Dashboard
Improved Chart and Visualization Enhancement
We’ve enhanced dashboard visualizations and chart capabilities to help you analyze and interpret your data more effectively:
- Area Chart Support: You can now use Area graphs in combo charts on metric tiles for improved data representation.
- Improved Line Chart Tooltips: When you hover over dense metric charts, tooltips now display values for all nearby timeseries simultaneously, making it easier to compare multiple data points.
- Granular Time Resolution: All tile types now support 5-minute interval data points when you visualize data within a 1-hour time period.
- On-Demand Step Customization: You can now adjust the step size for metric tiles directly from the dashboard without modifying the underlying query.
- Sankey Visualization: You can now create Sankey diagrams to visualize inbound and outbound network bandwidth between sources and destinations, helping you identify network bottlenecks, traffic patterns, and congestion contributors.
Dashboard Management Enhancement
We’ve improved dashboard management to give you more control and flexibility:
- Dashboard Ownership Transfer: If you’re a dashboard owner or administrator, you can now transfer dashboard ownership to other authorized users, ensuring continuity during vacations or team transitions.
- Enhanced Dashboard Listing: The dashboard slideout now displays full dashboard names, and you can manually resize the listing panel. Your panel width preference is automatically saved until you clear your browser cache.
- Room Mode Exit Option: You can now explicitly stop a dashboard running in room mode for better control.
Custom Dashboard Variables New Feature
You can now define dashboard variables with static values using the new Custom data source type. This allows you to create custom values tailored to your specific business needs. When you define multiple predefined values (for example, 1h, 2h), they appear as a dropdown menu for easy selection.
NetFlow Table Configuration Enhancement
We’ve streamlined NetFlow tile table configuration by automatically aligning Display Columns with your selected GroupBy fields. This eliminates the need for manual dual-entry and ensures your table views always match your data groupings.
Public Cloud
Cradlepoint Integration Enhancement
Cradlepoint integration has been improved for better resource visibility and navigation:
- Site Name (physical address) is now available as an attribute for both Router and Interface resources, providing better location context.
- Network interfaces now display the parent router name, making it easier to identify and navigate resources.
- Routers and Interfaces now have bidirectional relationships, improving resource mapping and impact analysis.
Cloud Integration - Job Completion Summary (GCP, Azure, AWS) Enhancement
We’ve improved cloud integration job completion messages to provide deeper operational insights across your public cloud environments.
Integration job summaries now include:
- Installed resources
- Skipped and filtered resources
- Total resources processed
This enhancement applies to:
- Google Cloud Organization
- Azure Tenant
- AWS Account integrations
You can access the enhanced job completion details in the View Logs section of your cloud integration.
Oracle Alloy Integration Enhancement
Extended Oracle Cloud integration to support Oracle Alloy environments. You’ll now see a new OCI Type selector in the Integration Account Information page with the following options:
- OCI - Continues the existing integration workflow
- OCI Alloy - Enables additional configuration fields such as Private Domain and custom Region inputs
You can now seamlessly onboard and monitor Oracle Alloy environments alongside your standard Oracle Cloud Infrastructure (OCI) resources.

See Oracle Cloud Installation and Configuration for more information.
Azure Cloud Monitoring - G2 Templates Enhancement
We’ve introduced the following enhancements to Azure Cloud observability, focusing on standardization, accuracy, and broader coverage.
What’s New:
- Unified and standardized G2 monitoring templates to improve visibility and consistency across your Azure environments
- Updated Azure metrics aligned with the latest platform changes, ensuring improved accuracy and expanded coverage
- Deeper insights across key Azure services, including compute, storage, database, and networking
Key Updates:
- Global G2 monitoring templates and global Discovery & Monitoring Profiles (DMPs) are now available for all supported Azure Cloud resource types
- Both G1 and G2 templates continue to be supported. If you apply both templates to the same resource, G2 is automatically prioritized, and only G2 metrics are collected
- Added support for Azure Virtual Machine Scale Sets resource type
Following resource types have been deprecated:
- Azure Blockchain Members
- Azure Customer Insights
- Azure Media Services
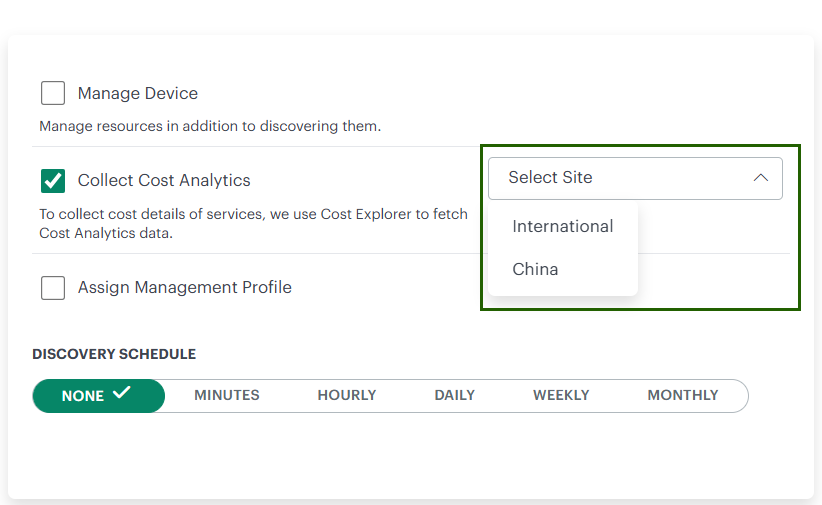
Alibaba Cloud Billing and Cost Analytics New Feature
OpsRamp now supports Alibaba Cloud billing and cost data collection, providing visibility into your cloud spend across Alibaba Cloud environments.
- Cost and usage data are retrieved from Alibaba Cloud Billing APIs and displayed in Cloud Cost Insights
- You can enable this capability by selecting Collect Cost Analytics in the Options tab of your Alibaba Cloud integration
- Once enabled, OpsRamp automatically ingests billing data for cost analysis and reporting
See Alibaba Cloud billing for more information.
SaaS Applications
Cisco Fabric Interconnect Enhancement
Enhanced monitoring capabilities for Cisco Intersight Fabric Interconnects.
What’s New:
- Added the Operability metric to provide better visibility into your device’s operational health
Metric Details:
- A value of 1 indicates the device is online
- All other values indicate a non-operational state
See Cisco Intersight for more information.
Log Management
Log Retention Enhancement
We’ve improved log retention management with the following enhancements:
- Retroactive Policy Application: Log retention policy updates now apply consistently across both existing and newly ingested logs. When you modify the retention period, the updated setting is automatically applied to your previously ingested log data, ensuring uniform retention behavior and improved compliance.
- Extended Retention Options: We’ve added new log retention options of 60, 90, 180, and 365 days in the Log Management module, expanding the existing 7, 15, and 30-day choices to support longer-term log storage and compliance requirements.
Resource Management
OpsQL Support for externalResourceIds Attribute Enhancement
You can now use the externalResourceIds attribute in OpsQL queries on the Infrastructure Search page to filter resources. Additionally, you can use this attribute in OpsQL queries within Groups, Sites, and template-based alert definitions.
Tenancy and RBAC
Default Report Notifications for New SSO Users Enhancement
For new users onboarded through SSO, the Report Notification option is now enabled by default. This ensures you automatically receive reports without needing to manually configure the setting, improving visibility and reducing setup effort for critical notifications.
Service Management
ServiceNow Integration Enhancement - Inference Alerts Enhancement
We’ve enhanced the ServiceNow integration to improve incident context and troubleshooting efficiency.
Previously, when investigating incidents in ServiceNow, you had limited visibility into related inference alerts, making it difficult to understand the full context of an issue or identify root causes quickly. This often required switching between multiple systems to piece together the complete picture.
With this enhancement, you can now reference and view inference alerts directly within an incident ticket. This provides immediate access to correlated alert data, helping you accelerate diagnosis, reduce mean time to resolution (MTTR), and make more informed decisions without leaving your ServiceNow workspace.
Partner Tenancy Enhancement - Status Flows Enhancement
We’ve improved flexibility for partner users in managing status flows. If you’re a partner user, you can now view and use status flows at both the client tenancy and partner tenancy levels.
Process Automation
Support for Passing Custom JSON Objects to Automation Integration Events Enhancement
You can now pass inline custom JSON objects to automation integration events through Process Workflow.
Previously, automation integration events only supported predefined data, and you couldn’t pass custom or derived JSON payloads directly. This limitation made it difficult to customize event data for downstream integrations.
With this enhancement, you can define and pass custom key-value pairs or dynamically derived JSON objects directly within your workflow. This provides greater flexibility when triggering automation integrations and enables richer, more context-aware event payloads.
Reporting Apps
Multi-Client Selection in Asset Inventory Details and Monitor Details Apps Enhancement
The Asset Inventory Details and Monitor Details apps now allow you to select multiple clients within the Partner scope, with a maximum limit of 50 clients per selection. This enhancement makes it easier to generate reports based on multiple client criteria.
By using this feature, you can efficiently filter and retrieve only the relevant client data, substantially minimizing the manual effort required to filter client data after generating reports for all clients.
External Resource ID Support in Reporting Apps Enhancement
You can now use the External Resource Id attribute in OpsQL queries and in attribute selection within Reporting Apps. This enhancement allows you to:
- Query the External Resource Id attribute directly within your OpsQL queries
- Select the External Resource Id attribute in the attributes section when configuring reports, providing greater flexibility to search devices using this attribute
- View the External Resource Id attribute in your generated reports
Partner Scope App Can Fetch Client-Specific Tags Enhancement
In partner scope apps, you can now filter resources by client-specific tags, allowing for more precise and tailored searches.
In OpsQL filters, you can now search by tag name to find matching tags within the system. Additionally, you can select tags from the attributes section, enabling you to view the specific tag values assigned to resources within your report.
Metric Insights Enhancement
We’ve enhanced the Metric Insights App with the following improvements:
Summary Option:
When you select the Summary option, your report includes the latest timestamp details of the minimum and maximum metric values for your selected metrics on resources over the selected period. In the Insights tab, the latest timestamp details of the selected metrics for the top and bottom 5 resources are also included.
This feature helps you easily identify when your resources last registered their lowest and highest metric readings during the selected timeframe.
Rollup Data Option:
When you select the Rollup Data option, both the resource hostname and IP address are appended to the resource name displayed in the resource selection drop-down menu.
This helps you uniquely identify each resource, making it easier to distinguish between similar or identical resource names when selecting a resource.
Service Maps
Service Map Landing Page for Partner Users Enhancement
If you’re a partner user, you can now view Service Maps directly upon login. All Service Maps created for individual clients are displayed in the Partner context and organized by availability state.
For each client, the landing page shows the count of Service Maps grouped by the following availability states: UP, DOWN, DEGRADED.

Upcoming Release
Monitoring Management
Metric Threshold Customization Update Enhancement
We’ve improved metric-level threshold customization at the template and resource-component levels to ensure more consistent handling.
This enhancement applies to metrics collected from Agent and Gateway (G2) templates and will be available starting with the April 2026 release.
For Synthetics, Public Clouds, and SaaS applications (G2) templates, it will be addressed in the May and June 2026 releases.
As a result of this change, you may notice changes in alert behavior—for example, additional alerts may be generated, or some existing alerts may no longer trigger.
For details on the updated threshold behavior, refer to Template and Resource Level Metric Customization Combinations.
End-of-Life Announcement
End of Life: Classic Service Desk Configuration and Automation
Effective March 2026, Classic Service Desk Configuration and Automation will reach End of Life (EOL) and will no longer be supported in OpsRamp. This change is part of our ongoing effort to deliver a more modern, consistent, and scalable Service Desk experience.
- Access to Classic Service Desk Configuration and Automation will be removed starting with the March 2026 release
- You should migrate to V2 Service Desk Configuration and Automation, which offers enhanced user experience and improved functionality, before the End-of-Life date
- Your existing data configured in the Classic Service Desk UI will continue to be available and visible in the new V2 Service Desk Configuration and Automation UI
To access V2 Service Desk Configuration and Automation, navigate to Setup > Account > Service Desk or use the Quick Links section on the Tickets listing page.
V2 Service Desk Configuration and Automation page:

Tickets Quick Links section:

Deprecation Notice
The following integrations are being deprecated:
- CyberArk Password Manager
- ManageEngine Password Manager
- Effective Date: April 2026
- Announcement Date: March 2026
See Deprecation Notice for more information.
- Classic Rosters
- Effective Date: May 2026
- Announcement Date: March 2026
See Deprecation Notice for more information.