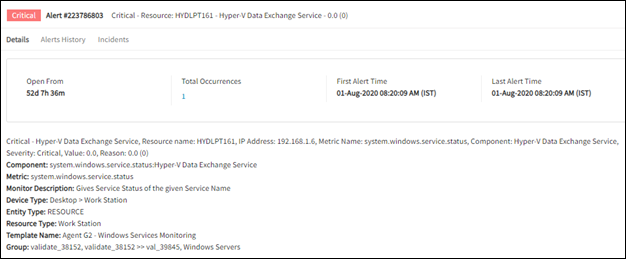
Windows Service Monitoring in OpsRamp enables users to monitor Windows services defined in the parameters section. Multiple services can be monitored by providing the necessary information.
Users can monitor Windows services based on server activities and apply multiple templates. Creating templates with different service names as metrics allows for monitoring multiple services. If the same service name is used under different metrics, OpsRamp merges the metric graphs as one instance.
Using Windows services monitoring, you can:
- Monitor service status
- Monitor specific or all Windows services state changes
- Generate alerts using Agent-based monitoring templates
Use the following global template and metric name for Windows services monitoring:
- Template name: Agent G2 - Windows Services Monitoring
- Metric name: system.windows.service.status
Prerequisites
Include service names (with comma separated) in the Value text-box while assigning the template to a device. For example,
opsramp-agent,opsramp-shield,svsvc,vmickvpexchange,wuauserv.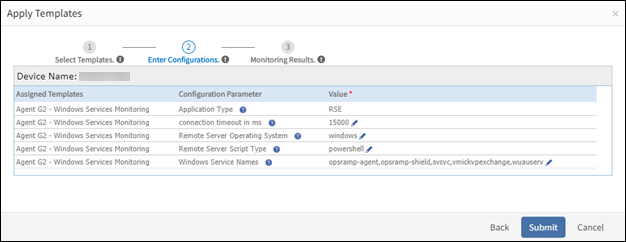
Install the agent on the target device to run the scripts.
Important Notes
- If the same metric name is used in multiple Windows service templates, only one graph widget will be created with a random template name, and it will populate graph data for all services across all templates.
- If different metric names are used in multiple Windows service templates, separate graph widgets will be created, and each will populate graph data for its respective template.
- G2 and G1 Templates - The services are different in G2 & G1 templates and to be followed as below:
- G2 Service Monitoring: Provide the exact ServiceNames as input parameters, separated by commas (without spaces in between each service after a comma), when you apply the template at the device level.
- G1 Service Monitoring:
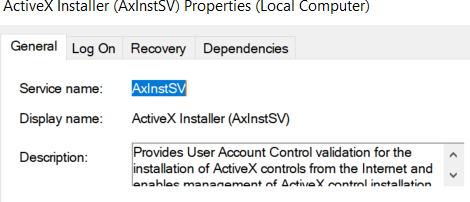
Provide the exact Service Display Name, as shown in below screenshot.
For example: If the two services are down, you will receive two different critical alerts for each service with their status is NOT RUNNING.
Below is an example to show the service Name & Displace name in Service explorer.
- While creating a G1 Service Monitoring template, you have the two options: Ignore services and Consider services.
- Ignore Services: This option is enabled by default, meaning that any input services not registered on the devices will be ignored.
- Consider Services: If the user activates the “Consider services” option, all specified input services will be monitored, even those are not registered on the devices.
Create Windows Services Monitoring
To define a windows service monitors includes 3 steps.
- Metric Configuration
- Monitor Configuration
- Template Configurations
Metric Configuration
Create a copy of the “system.windows.service.status” metric for all services that you want to monitor.
- Select a client from the All Clients list.
- Navigate to Setup > Monitoring > Metrics.
- Search for the global “system.windows.service.status” metric and take note of all of the fields.
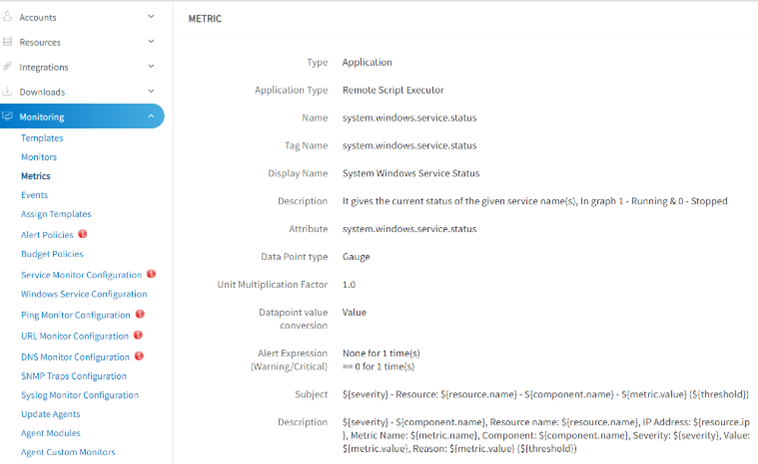
- From Metrics, click +Add. Add all of the same detail copied from step 3 but change the below:
Name - system.windows.service.status.{SERVICE NAME}
Display Name - {SERVICE NAME} or {SERVICE DESCRIPTION}
Examples:- For Single Services
Name - system.windows.service.status.AppHostSvc
Display Name = Application Host Helper Service - For Multiple Services
Metric Name - system.windows.service.status.default.windows.services
Display Name - App Readiness, SNMP Trap, Windows Event log
- For Single Services
Monitor Configuration
The next step is to create copies of the “Agent G2 - Windows Services Custom Monitor” monitor for each metric.
- Select a client from the All Clients list.
- Navigate to Setup > Monitoring > Monitors.
- Search for the global “Agent G2 - Windows Services Custom Monitor” monitor and take a copy of it.
- Select the monitor scope and name the monitor with the service name.
- Monitor Scope - ? e.g. client
- Name - Test_service_monitor_ AppHostSvc
- Click Save to save the changes.
- Edit the new monitor and delete the “system.windows.service.status metric”.

- Add the metric for the service you created earlier.
- Repeat the steps 1 to 7 for each metric that you want to monitor.
Template Configurations
The next step is to create copies of the “Agent G2 - Windows Services Monitoring” template for each monitor.
- Select a client from the All Clients list.
- Navigate to Setup > Monitoring > Templates.
- Search for the global “Agent G2 - Windows Services Monitoring” template and take a copy of it.
- Select the template scope and name the template with the service name.
- Partner =
- Client =
- Name = Test_AppHostSvc_Agent G2 - Windows Services Monitoring
- Click Save to save the changes.
- Edit the new template and delete the “Agent G2 - Windows Services Custom Monitor” monitor.

- Add the monitor for the service you created earlier.
- Repeat the steps 1 to 7 for each metric that you want to monitor.
Validate Templates
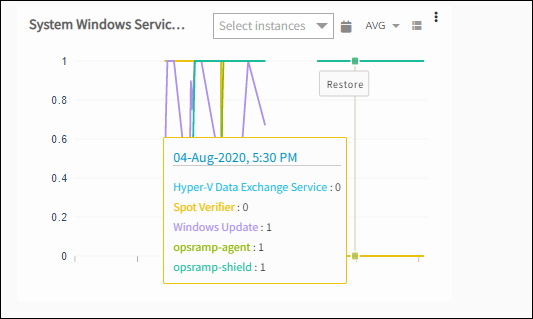
After the configured services are running on the target devices, view the metric graph using Infrastructure > Resources > Device Details > Metrics. The graph displays the following metric values:
- 1 - Services are running
- 0 - Services are not running
Windows Services Monitor Alerts
View the Windows services alerts in the Alert browser. Examine the alert description to view the last modified time.
