The Component Filters feature is applicable for all G2 based templates (Agent and Gateway collector types).
Introduction
This feature is helpful in cases where a client wants to filter the components or instances of any metric in the G2 template as per their requirements. By using these component filters, you can monitor specific components or ignore unwanted components from monitoring.
Add Component Filter
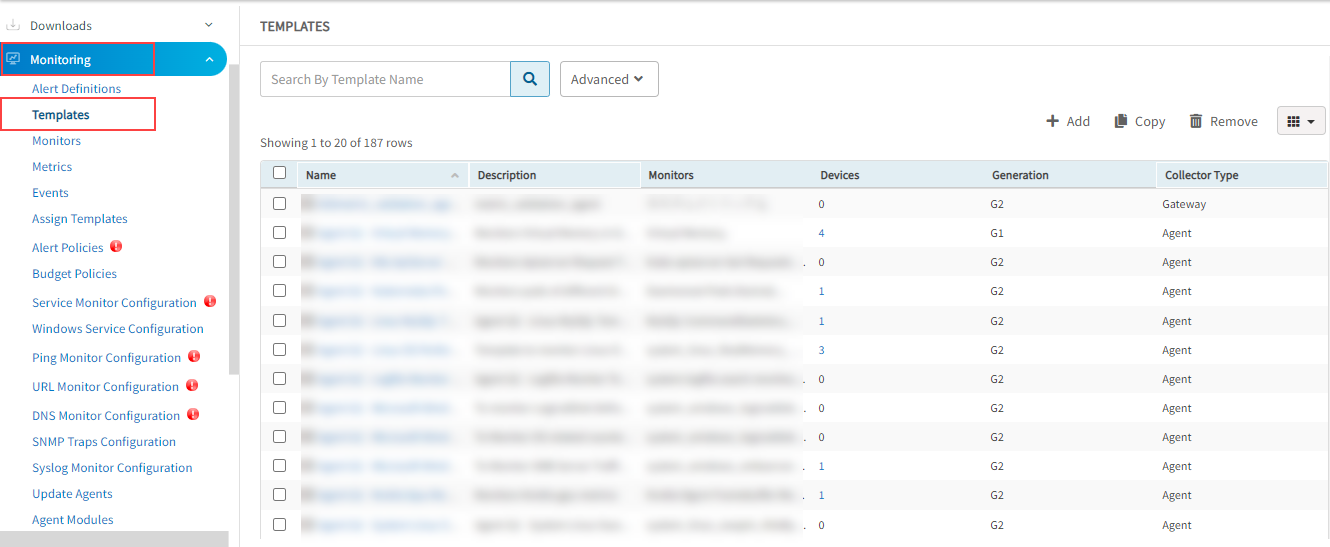
- Go to Setup > Monitoring.
- Under Monitoring, click Templates. The TEMPLATES listing page is displayed.

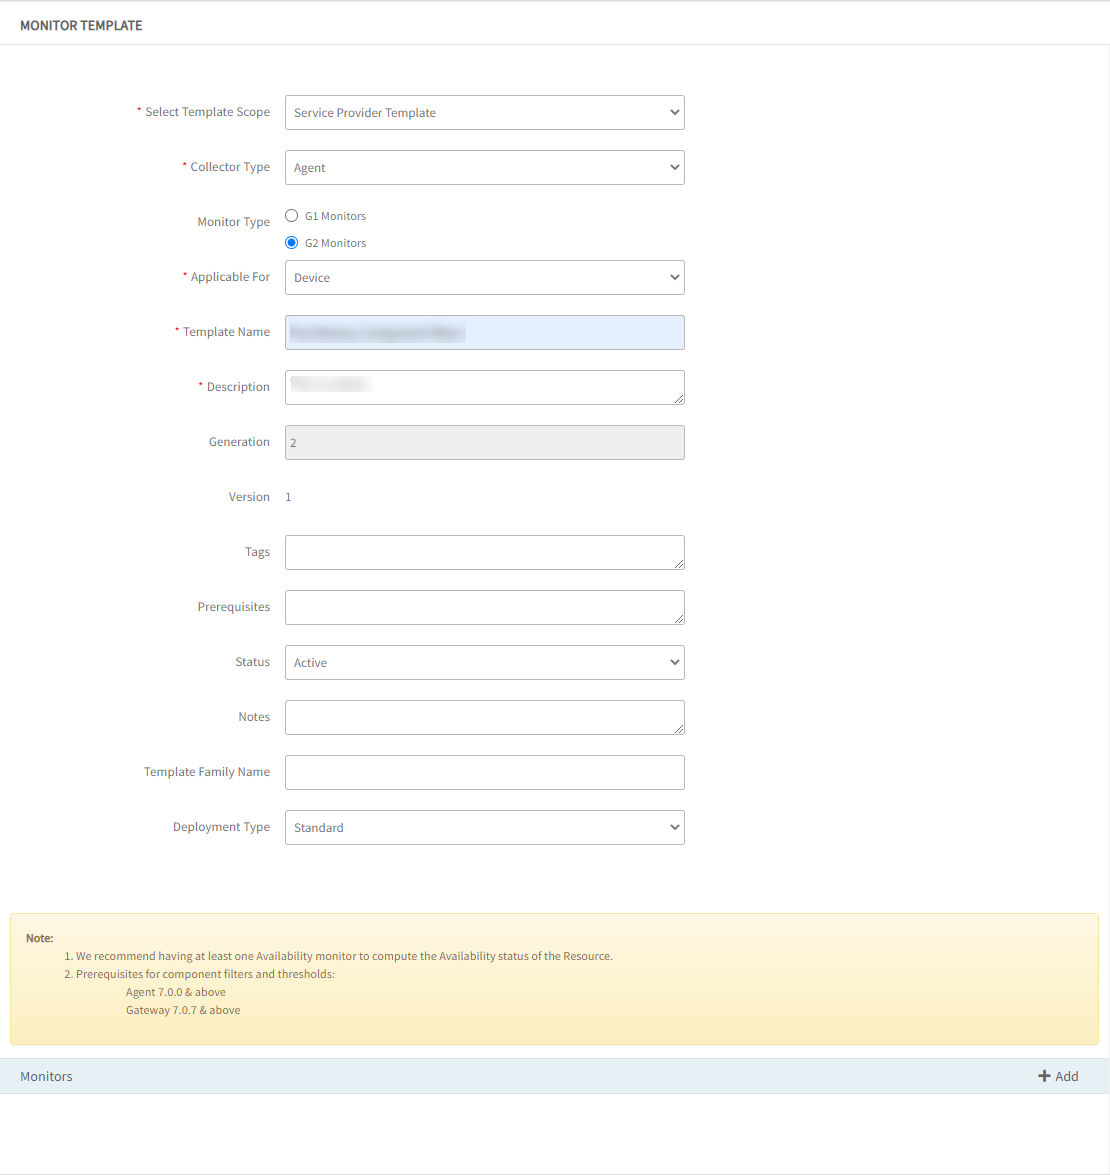
- Click + Add. The MONITOR TEMPLATE page is displayed.
- Configure the following parameters from the MONITOR TEMPLATE page:
| Parameters | Operation |
|---|---|
| Select Template Scope | Partner Template or Client Specific Template. For a Client-Specific Template, select the Client also. |
| Collector Type | The Collector through which you want to gather the information. For example: Agent, Gateway. |
| Monitor Type | Monitor for G2 Templates. |
| Applicable for | The resource type of the template. |
| Template Name | Name of the template. For example, G2 MSSQL Database Transactions Time Template. |
| Description | The summary of the template. |
| Generation | Generation that the template belongs to. For example, Generation 2. |
| Version | Global templates may exist with different versions. SP/Partner/Client templates have only one version: Version 1. |
| Tags | Provide a description for the tag. |
| Prerequisites | The required details are considered while monitoring using the template. For example, check the SQL services while monitoring the SQL Parameters using the Windows templates. |
| Status | The Active or End-of-life templates. |
| Notes | The information that you want to add to the template. |
| Template Family Name | The category that applies to the application. For example, Windows Server, Storage Server, and Network Server. |
| Deployment Type | The methods available to apply the template to the resources: Custom, Optional, Standard After providing the template details, MONITOR TEMPLATE displays the Monitors section. The MONITOR TEMPLATE screen varies with the option selected in the Collector Type field. |

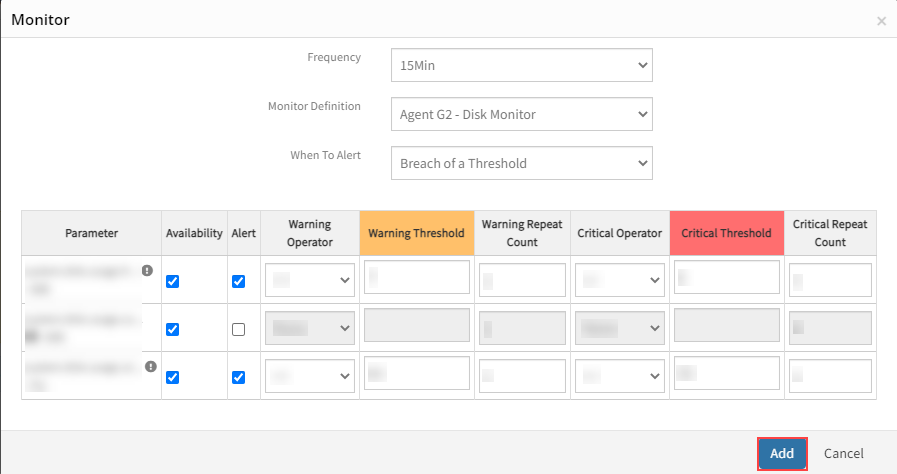
- Under the Monitors section, click + Add to add monitors. Note: Duplicate metrics cannot be added in G2 templates.
- From the Monitor window, enter the following details:
- Frequency: The frequency to execute the template.
- Monitor Definition: Monitor type.
- When to Alert: There are three options:
- Breach of a Threshold (default):
- Enter the required values.
- Select Alert and Availability to initiate monitoring.
- Significant Change is Seen: Add values, as required.
- Forecast of a Breach of a Threshold: Add values, as required.
- Breach of a Threshold (default):
- Click Add.

- Click Add, under the Component Filter section.

- The Edit Metric Filter is displayed. Click + Add.
- From the dropdown select the Operator and enter a name in the Name section.
- Click Add. Note: Save the template and apply it to the necessary devices.

Example:
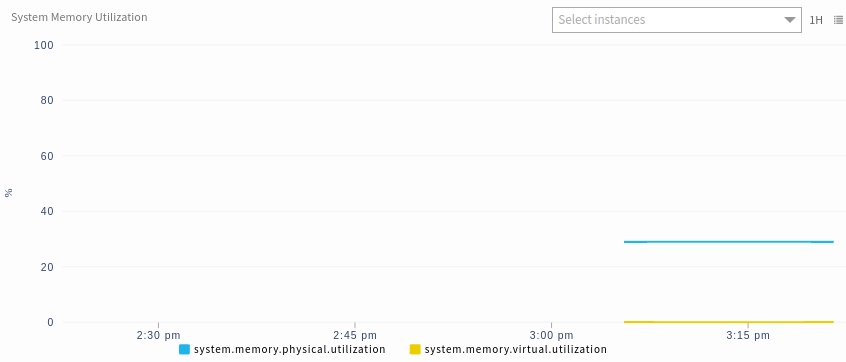
Here, for the metric system.memory.usage.utilization, we have 3 components named:
- system.memory.cache.utilization,
- system.memory.physical.utilization,
- system.memory.virtual.utilization

Sample Output Graph
