Overview
Resource availability is a state of a resource, and it is identified based on the alert on the availability metric and when the resource is onboarded on the OpsRamp.
OpsRamp continuously monitors the resources and keeps track of all the metrics samples. Whenever the availability metric reaches the critical threshold limit, an alert will be raised, and based on the alert, the resource’s availability state will be changed to DOWN.
Availability Calculation
Most of OpsRamp out-of-the-box templates include at least one or two metrics for availability calculation. These metrics will help to identify the availability state of a resource.
How to Configure the Availability
Follow the steps to configure the availability:
- Select any template of your choice and edit the template.
- Go to the Metrics section and then select the metric that is more important for the resource.
- Select the Availability checkbox and save the template.
- Apply the Template to the resources.
Note
You can select more than one metric so that the availability calculation will consider two metrics instead of one metric. Ideally, irrespective of the number of templates, two or three key metrics should be sufficient for identifying the availability state of a resource.Availability States
| Availability State | Description | Color Indication |
|---|---|---|
| UP | No critical alert on availability metrics. | GREEN |
| DOWN | Critical alert on availability metrics. | RED |
| UNKNOWN | Data samples are not available for the availability metrics. | GREY |
| UNDEFINED | No availability metric on the resource. | BROWN |
| UNMONITORED | These resources are not supported for monitoring. | LIGHT TEAL |
The onboarded resources of your client fall under any of the above categories.
Availability Rules
When you apply a template, the first option ALL is selected by default, but you can change it to ANY if you prefer. To change, select the Resource, then click the Monitors tab on the right side, and then click Availability Rule.
Note
The Availability rule applies to the resources with more than one Availability metric. If you have only one availability metric, then the ALL/ANY rule does not apply.Availability calculation is divided into two parts:
- ALL: This option means, if all the Availability metrics do not have any critical alert, then the resource is considered UP (OK). If any of the Availability metrics has a critical alert, then the resource is considered as DOWN.
- ANY: This option means, if any of the Availability metrics do not have a critical alert, then the resource is considered as UP (OK). If all the Availability metrics have a critical alert, then the resource is considered as DOWN.
You will find the options below and you have the option to switch between them.
- Resource is UP, if ALL availability metrics are OK. Otherwise, the resource is DOWN.
- Resource is UP, if ANY availability metric is OK. Otherwise, the resource is DOWN.
Possible States for Availability Rule
The below table explains the state of a resource based on all the possible combinations of availability metrics.
Assuming you have two availability metrics on a resource.
How will the state be calculated for ALL rules?
Resource is UP, if ALL availability metrics are OK. Otherwise, the resource is Down.
| Metric Sample#1 | Metric Sample#2 | Sample#1 Critical Alert? | Sample#2 Critical Alert? | Availability | |
|---|---|---|---|---|---|
| Resource A | Collected | Collected | No | No | UP |
| Resource A | Collected | Collected | Yes | Yes | DOWN |
| Resource A | Collected | Collected | Yes | No | DOWN |
| Resource A | Collected | Not collected | Yes | N/A | DOWN |
| Resource A | Collected | Not collected | No | N/A | UNKNOWN |
| Resource A | Not collected | Not collected | Yes | N/A | DOWN |
| Resource A | Not collected | Not collected | N/A | N/A | UNKNOWN |
How will the state be calculated for ANY rules?
Resource is UP, if ANY availability metric is OK. Otherwise, the resource is DOWN.
| Metric Sample#1 | Metric Sample#2 | Sample#1 Critical Alert? | Sample#2 Critical Alert? | Availability | |
|---|---|---|---|---|---|
| Resource A | Collected | Collected | No | No | UP |
| Resource A | Collected | Collected | Yes | Yes | DOWN |
| Resource A | Collected | Collected | Yes | No | UP |
| Resource A | Collected | Not collected | Yes | N/A | UP |
| Resource A | Collected | Not collected | No | N/A | UP |
| Resource A | Not collected | Not collected | Yes | N/A | UNKNOWN |
| Resource A | Not collected | Not collected | N/A | N/A | UNKNOWN |
When to go for the ALL Availability rule?
If you are really concerned about ALL availability metrics and expect those metrics to be always healthy, i.e., metric samples are below the critical threshold limits, then you should go with this rule.
Therefore, if you want your resource to be in the UP state, then all availability metrics should be below the critical threshold limit.
When to go for ANY Availability rule?
If you are only concerned about ANY one of the availability metrics and you expect one of the metrics in healthy i.e., the metric sample is below the critical threshold limits, then you should go with this rule.
Therefore, if you want your resource to be in UP state, then any one of the availability metrics should be below the critical threshold limit.
Resource Availability Score
Resource availability score is calculated based on the state of the availability metric.
Example: If the availability of a resource is DOWN for sometime, then the overall resource availability score is impacted.
How the resource Availability State% works
Example: A resource was onboarded in OpsRamp on January 1st, and on January 2nd, a monitoring template was assigned to the resource, but no monitoring data was collected for one day due to different reasons. On January 3rd, OpsRamp started collecting data, and there were no critical alerts on the availability metrics for one day. On January 4th, a critical alert was generated for the resource on the availability metric.
By considering the above example, the last four days of resource Availability State% will be:
UP: 25%
DOWN: 25%
UNKNOWN: 25%
UNDEFINED: 25%
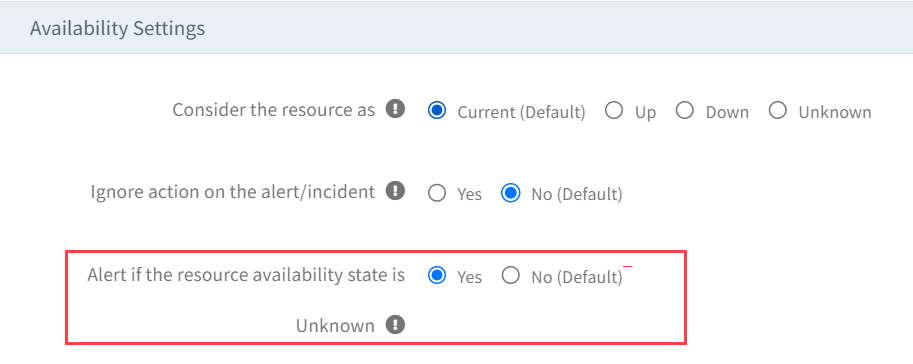
Generate alert for the resources with unknown availability state
When does a resource go into an Unknown Availability State?
A template that has at least one availability metric is applied to a resource. The resource goes into an UNKNOWN state when there is no data sample collected for the metric(s).
Following are the examples based on the monitoring template frequency:
| Availability Metric frequency | Description |
|---|---|
| < 30 minutes | OpsRamp will wait for 30 minutes for the data samples and if there are no data samples then the resource will be moved to UNKNOWN state. |
| Equal to 30 minutes | OpsRamp will wait for 30 minutes + 30 minutes = 60 minutes for the data samples and if there are no data samples then the resource will be moved to UNKNOWN state. |
| > 30 minutes and <= 60 minutes | OpsRamp will wait for 60 minutes + 30 minutes = 90 minutes and if there are no data samples then the resource will be moved to UNKNOWN state. |
| > 60 minutes | OpsRamp will not consider the resource and it will not go to UNKNOWN state. This resource will not be part of the UNKNOWN alert. |
Note: Ensure your availability metric(s) frequency in the template is less than or equal to 60 minutes to identify the UNKNOWN state of the resource.
How will the user know if a resource goes into an UNKNOWN availability state?
A client-level critical alert will be generated every 30 minutes, if the resource availability state changes to the UNKNOWN state.
The critical alert contains a link to the list of resources with no monitoring data for the last 30 minutes. When you click the link, the Infrastructure > Search page is displayed, with a list of UNKNOWN resources.
The alert is auto healed, if all the resources in the provided link are moved out of the UNKNOWN state.
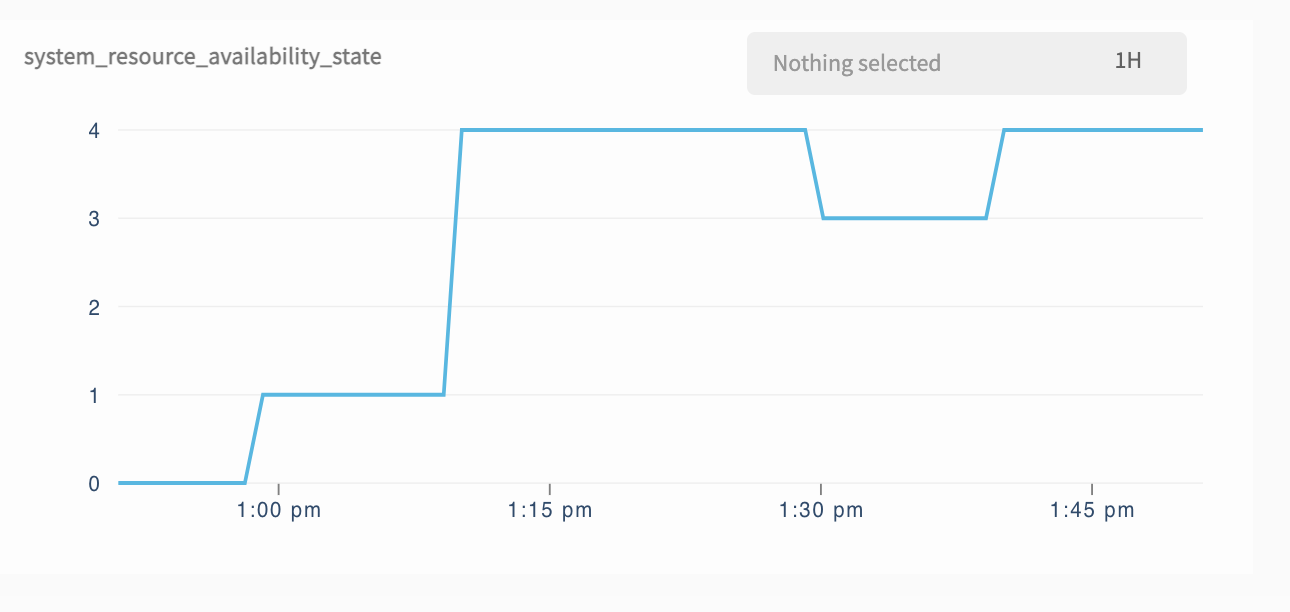
The alert is generated on the metric name system_resource_availability_state. This alert is not shown on the resource, so you have to check the
Command Center > Alerts page.
This alerting option is, by default, in the disabled state. You can Enable/Disable the option from the Setup > Accounts > Clients page.

Availability graph on the resource
This graph shows, by default, on all the resources that support monitoring. If your resource is in UNMONITORED category on the Resource page, then this graph is not supported.
You can see this graph in the Resource > Metrics tab.

Each number represents the availability state:
| Y axis value | Availability State |
|---|---|
| 0 | UNDEFINED |
| 1 | UNKNOWN |
| 3 | DOWN |
| 4 | UP |
What happens to the availability of the resources if the agent or gateway communication to OpsRamp is down?
Agent/Gateway, by default, has an internal buffer to store the last one hour of metric data and 24 hours of alerting data. During this period, when agent/gateway stops sending the data to the OpsRamp cloud due to network issues then the resources monitored by the agent/gateway will be shown as unknown. Once the communication re-establishes and agent/gateway sends the data stored in the buffer then OpsRamp will recalculate the availability every 6 hours and the availability states will be re-adjusted.
In case of communication issues, the availability states will be re-calculated for the last hour and anything before the last one hour will be considered as UNKNOWN.
How to configure the resource availability state during scheduled maintenance?
By default, the resource’s actual state will be considered irrespective of whether it is in scheduled maintenance or not.
You have an option to change how your resources need to be treated during the scheduled maintenance period. Navigate to Setup > Accounts > Clients page and select the state as per your requirement.

Example: If you select UP, during the scheduled maintenance, even if your resource is powered off / restarted, the resource availability will be shown as UP.
Ignore actions on the alert/incident while calculating the availability
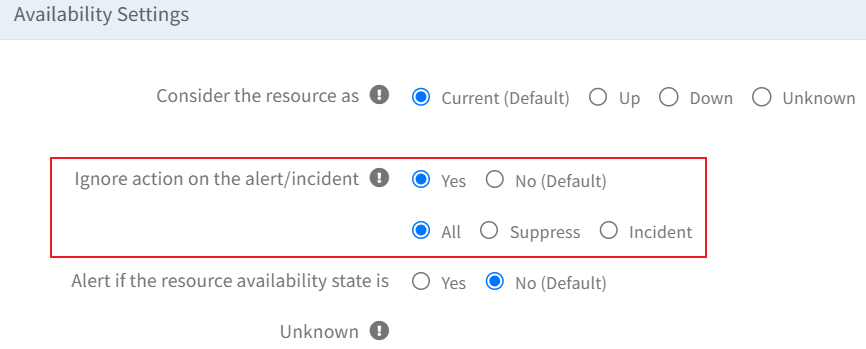
This option is turned off by default. If you change it to YES, OpsRamp will ignore the suppression action on the alert or resolve/close action on the incident. This means that unless the critical alert receives the actual heal, the availability state of the resource remains unchanged.
Example: You have a monitoring template with the metric name system_ping_packetloss as the availability metric, and the template is assigned to a resource R1. If you receive a critical alert on the metric then OpsRamp will change the availability state of the resource from UP to DOWN because resource R1 has a critical alert. An incident is generated for the alert.
If you select the YES option with the ALL radio button, resource R1 will remain DOWN even if someone suppresses the alert or close/resolve the incident, or both. The resource R1 availability will return to the UP state only if the metric value drops below the critical threshold. This means any alert suppression or incident resolution action will be ignored, and the availability state remains the same.
If you select the Suppress radio button, only the alert suppress action is ignored, and the incident resolve/close action will affect the availability.
If you select the Incident radio button, only the incident resolve/close action is ignored, and the alert suppress action will affect the availability.
If you select the NO option (default), any alert suppression action or incident resolution action will affect the availability state of resource R1 from DOWN to UP.
When to choose YES?
If you don’t want to keep any alert/incident open and prefer to close them after a specific time, but you do not want to affect the availability of the resource until it receives the heal alert, then you can choose the YES option.

See Create a Client for more information.