Introduction
The Topology Details app provides users with detailed insights into the relationships between their source and target resources. The app has been designed to provide comprehensive visibility into their infrastructure, empowering users to gain a better understanding of their network and system connections.
Configuration Parameters
- Query: Use the query to select the entities that you wish to include in the report.
- Default query: The default query
{state=active and monitorable=true}will be populated by default when the app opens. User can modify or delete the default query and run a specific query. - Using an OpsQL query, you can customize the report result. If the user did not select
stateandmonitorableattributes in the query string, in that case the user selection query would be appended by default withstateandmonitorableattributes.
For example: If the user only selected theagentInstalledattribute, the query would automatically appendstate = 'active' AND monitorable = true
The query will look like as below:state = "active" AND monitorable = "true" AND (agentInstalled = "xxxxxx")
- Default query: The default query
- Client Selection: You can select a single client or All Clients from the dropdown list. Only selected client data will get into the report.
- Report Content: Select report content to include selected resources as either a source, a destination, or both in the report.
- Relations: Select relations to include specific topology relationships among the resources in the report. You can select a maximum of 3 relations.
- Analysis Period: Only support the Snapshot option to analyze the report by default.
- Supported Format: Reports are generated only in XLSX format.
Reports Output
Once the report is generated, it will consist of the following sections:
| Section | Description |
|---|---|
| Summary | This section provides the configuration details of application. |
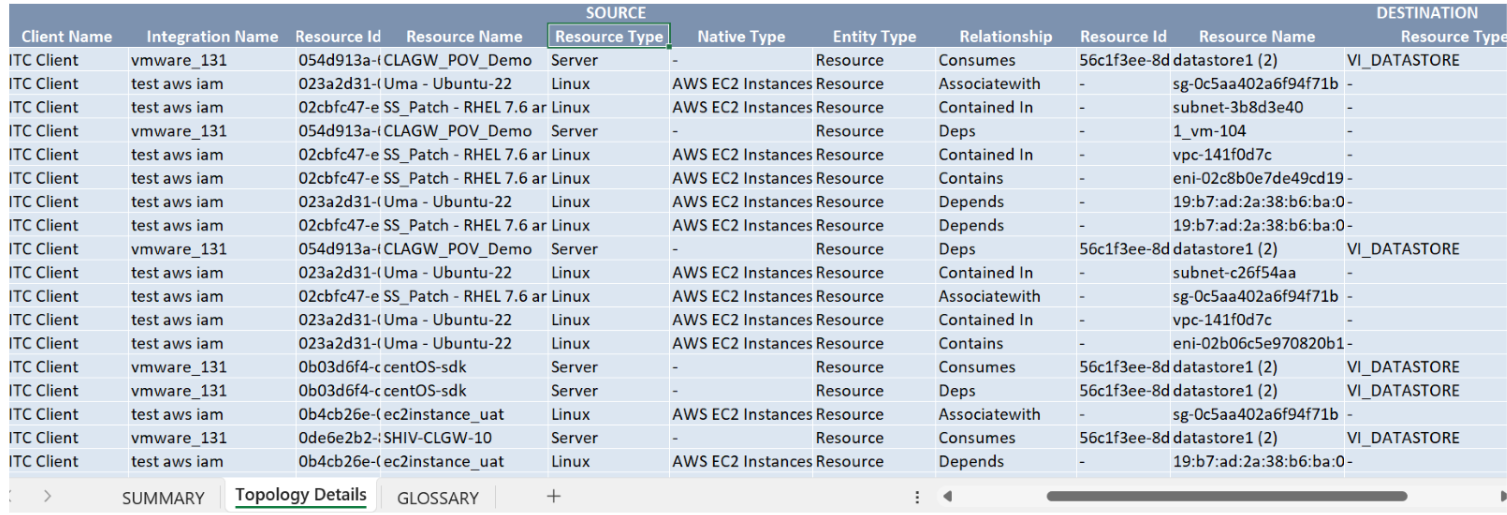
| Topology Details | It provides detailed information about the precise relationships among the resources in your infrastructure. |
| Glossary | This section contains detailed information about each section present in the report tab, helping you to understand the generated data better. |
Sample of reports in XLSX format: