Pie Visualization for Alert Tile
PIE visualization
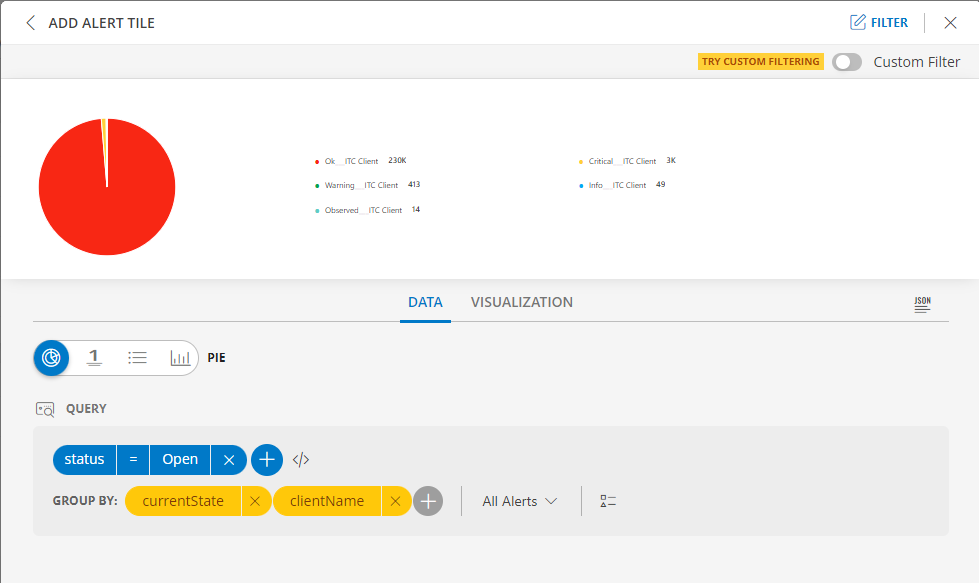
The following is the PIE chart visualization with the inputs:
- Attribute -
currentState = OK - Group By
- Attribute 1 =
status - Attribute 2 =
resource.name
- Attribute 1 =
- Legend -
{{make}} - Dashboard time range =
All Alerts
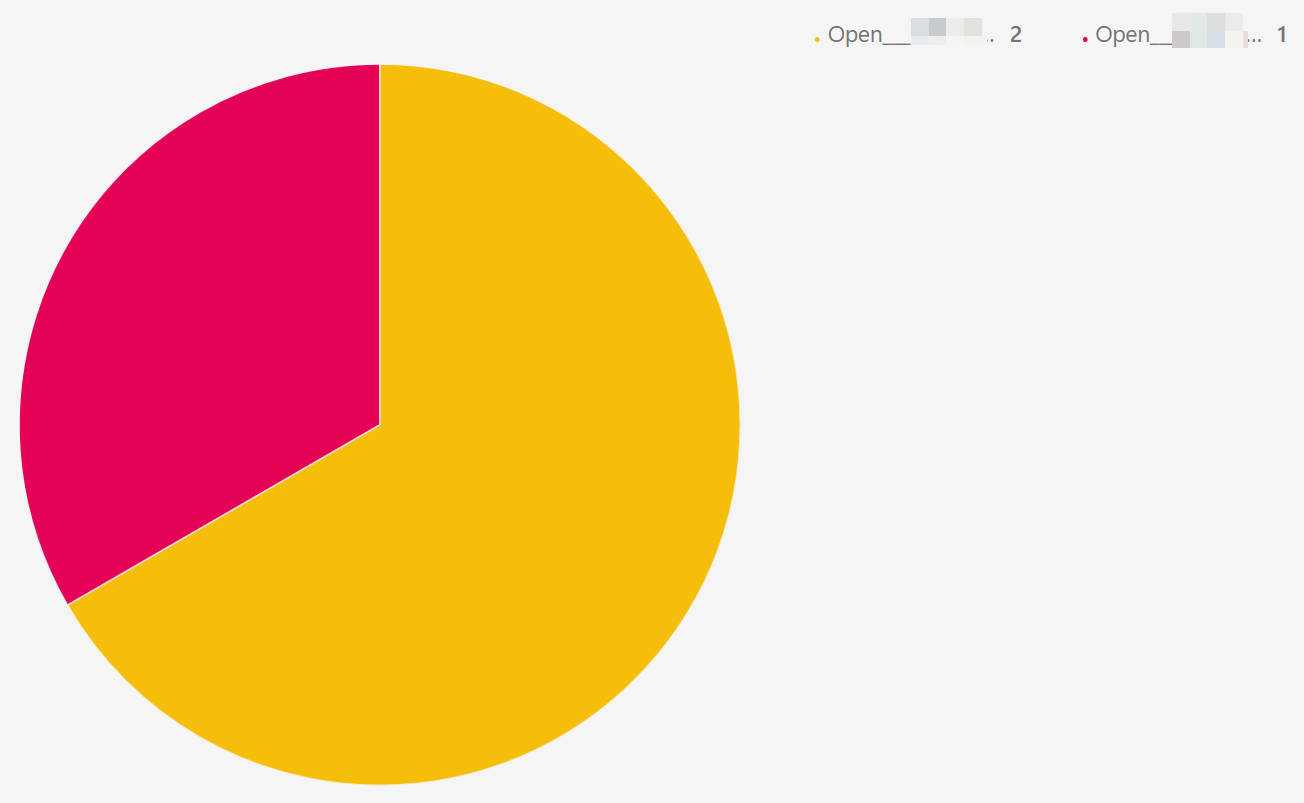
PIE dashboard view
The following is the PIE chart dashboard view:
Pie Visualization for Resource Tile
PIE visualization
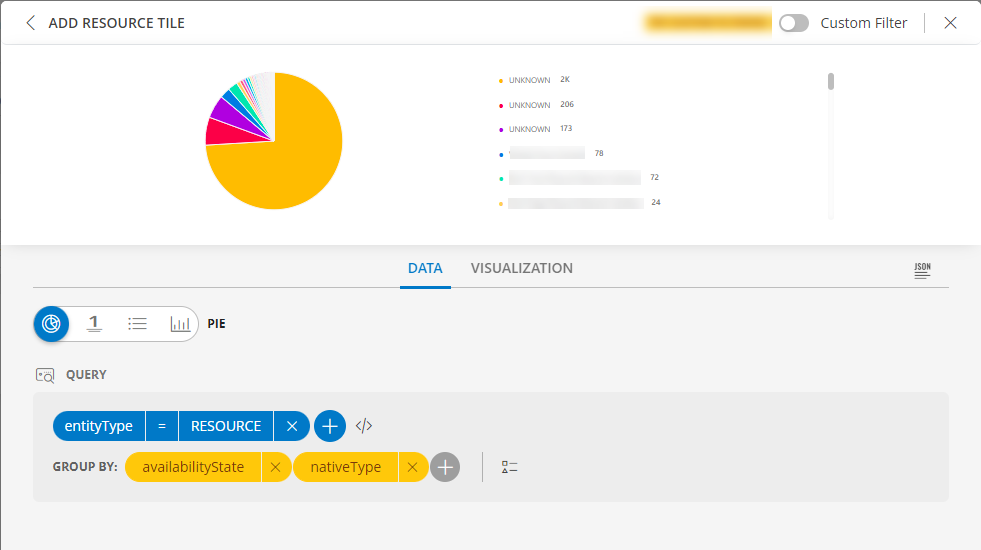
The following is the PIE chart visualization with the inputs:
- Attribute -
entityType = RESOURCE - Group By
- Attribute 1 =
availabilityState - Attribute 2 =
nativeType
- Attribute 1 =
- Legend -
{{nativeType}}
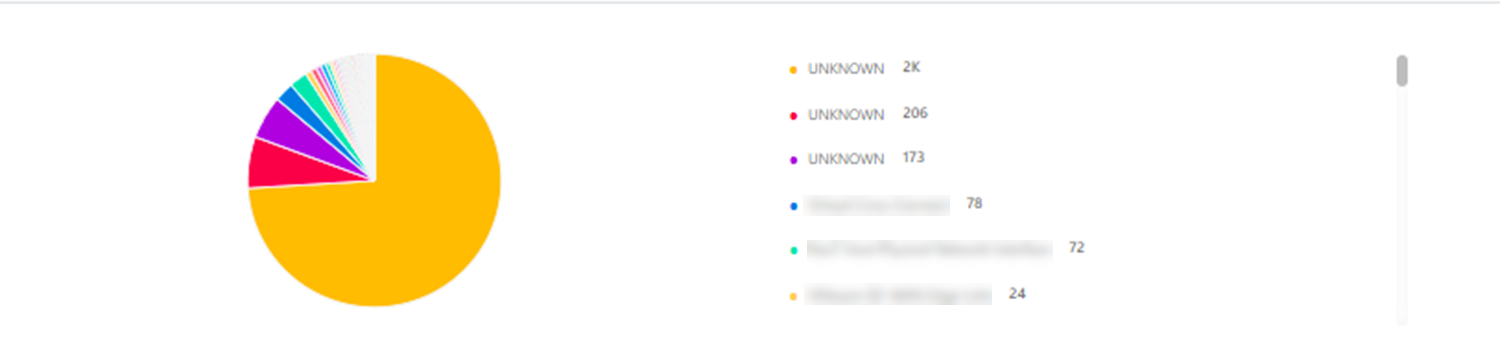
PIE dashboard view
The following is the PIE chart dashboard view:
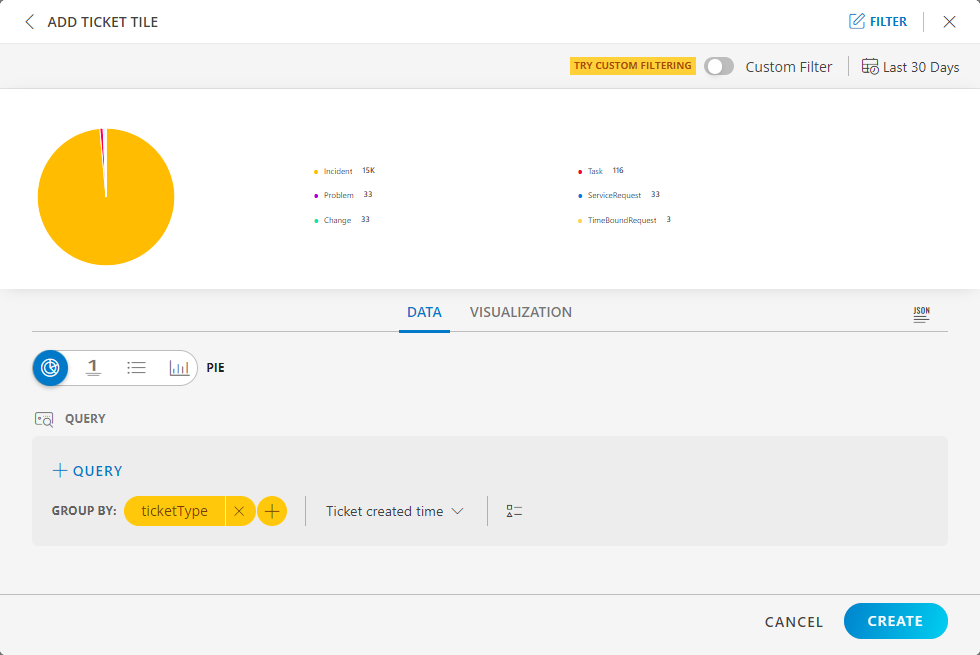
Pie Visualization for Ticket Tile
PIE visualization
The following is the PIE chart visualization with the inputs:
- Attribute -
clientName CONTAINS Clientname - Group By
- Attribute 1 =
assignee - Attribute 2 =
status
- Attribute 1 =
- Legend -
{{nativeType}} - Dashboard time range =
All Tickets
PIE dashboard view
The following is the PIE chart dashboard view: