Continuous Alerts on Synthetic Health for Gateway Resource
Issue:
You are receiving continuous alerts regarding the synthetic health of a Gateway resource.
Reason:
This issue may be caused by one or more of the following:
- The synthetics application is consuming high CPU and memory.
- There are communication issues with the OpsRamp server, either in receiving configurations or posting metric data.
- The application itself is not running properly.
Solution:
- Check Logs:
Review the logs to identify the specific issue causing the alerts. - Check Webprobe Health Stats:
Run the following command to check the health stats of the webprobe:- For Classic Gateway:
curl http://localhost:5481/stats - For NextGen Gateway (from the debug container):
curl http://webprobe:5481/stats
- For Classic Gateway:
- Contact Support:
If the issue persists, contact support. Provide the output from the above command and share the webprobe logs located in the/var/log/webprobe/directory.
Synthetic graphs not populating on the User Interface (UI)
Synthetic graphs do not populate data in the following scenarios:
Scenario 1: Network breakdown between the gateway and API server
Check the connection:
- Log into the gateway.
- Run the command:
curl http://localhost:5481/statsand check the following metrics:- webmon.offline.datapoints
- Webmon.monconf.sync.lapsed.time
Metric values other than zero indicate that the gateway communication is lost.

If you are using Proxy, check the health status of Proxy.
Scenario 2: Synthetic application: webprobe in gateway crashed or not running
Check the network:
- Log into gateway.
- Run the command:
curl http://localhost:5481/stats.
If the command does not generate a response in less than a minute, the webprobe is crashed or not running. Run the command monit restart webprobe to restart the application.
Scenario 3: Gateway is in Read-Only mode or Down
Check for open alerts in Read-Only mode or in Down state in the gateway. Contact Support to change the gateway status to UP.
Scenario 4: Delay in synthetic metric data processing in the cloud
Contact Support to check the synthetic metric data.
Linux commands to validate synthetic monitors
Refer to the following table to validate the synthetic monitor status.
| Protocol | Commands | Example |
|---|---|---|
| HTTP/HTTPS | curl -I -L [url] | curl -I -L www.opsramp.com |
| HTTP/HTTPs with Headers | curl -I -L --header '[header:value]' [URL] | curl -I -L --header 'host:opsramp.com' www.opsramp.com |
| PING | ping [url /IP] | ping www.opsramp.com / ping 127.0.0.1 |
| SSL | curl --insecure -v [URL] 2>&1 | awk 'BEGIN { cert=0 } /^\* Server certificate:/ { cert=1 } /^\*/ { if (cert) print }' | curl --insecure -v https://www.google.com 2>&1 | awk 'BEGIN { cert=0 } /^\* Server certificate:/ { cert=1 } /^\*/ { if (cert) print }' |
| TCP | telnet [host/IP] [port] | telnet www.opsramp.com 80 |
| UDP | telnet [host/IP] [port] | telnet www.opsramp.com 80 |
| DNS | nslookup [host] | nslookup www.opsramp.com |
| SMTP | curl [smtp-server] --mail-from [sender email address] --mail-rcpt [receiver email address] | curl smtp://mail.example.com --mail-from myself@example.com --mail-rcpt receiver@example.com |
| IMAP | curl -v imap://user:password@[imapserver] | curl -v imap://opsramp:password@imap.gmail.com/ |
| POP3 | curl -v pop3://user:password@[pop3 server] | curl -v pop3://opsramp:password@pop3.gmail.com/ |
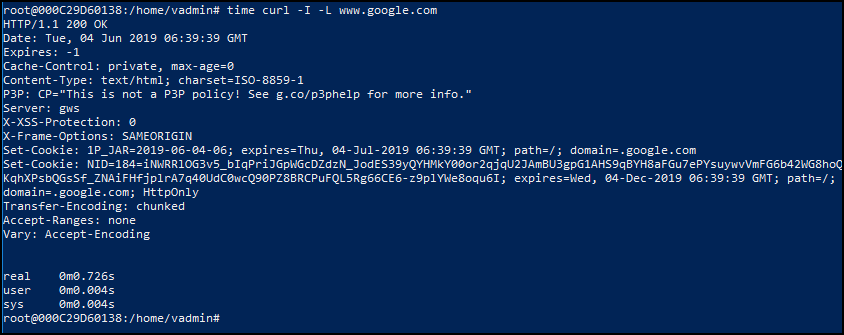
Check the Response Time and Response Code of a website (HTTP/HTTPS)
- Log into gateway.
- Run the command:
time curl -I -L <URL>.

Where i can find the webprobe.log and rca.log log files?
You can check the log files webprobe.log, rca.log stored under /var/log/webprobe directory and you will also have the backup files in the same directory.
- rca.log contains the RCA-related information of all the synthetic resources.
- webprobe.log only contains the info level logs by default and to get the debug level logs, you need to enable log_level to debug in the config.cfg file under /opt/opsramp/webprobe/conf/config.cfg and debug logs will be populated from the next minute.
False alerts generated in the absence of monitoring issues
To stop the generation of false alerts even in the absence of monitoring issues, set a value greater than or equal to one while configuring component threshold values for availability.down.locations.count. For more information, see Modifying Threshold Values.
Response time
You want to monitor the response time and availability of HTTP/HTTPS synthetics.
Solution:
Configure HTTP/HTTPS synthetic monitor and check the availability of the webserver to handle requests.
Expected response code
Can users validate the response code or not receive any notifications in the case of failure codes if they mandate response codes at the web server end (that could be an error in general)?
Answer:
Even if the configured response code is an error in general, users will be able to compare the response code to the configured expected Response Code and will not receive any alert notifications.
If the response code is not mentioned in the expected response code(s), the user will receive alert notifications.
Specific URLs
You want to monitor if the specified URL matches the expected IP addresses within the stipulated period.
Solution:
Configure DNS synthetic monitor to monitor the availability and response time of the Domain Name Servers.
Website performance
You want to monitor the performance of a new website after applying changes and during peak hours before launching them to the public.
Solution:
Configure SCRIPT HTTP synthetic transaction monitoring by simulating the activities performed by a user on the website.
FTP server
You want to monitor an FTP server with username and password and want to upload/download files.
Solution:
Configure FTP synthetic monitor to check the time taken to upload and download files from the FTP server.
SSL certificate
You create an application and deploys it as a synthetic. At the same time, you want to get notified about the SSL Certificate expiration date of any given URL.
Solution:
Configure SSL synthetic monitor to check the expiry date of the SSL Certificate.
Packet loss
You want to check the availability of any server or packet loss from four locations of North America.
Solution:
Configure PING synthetic monitor to check if all packets reach the host and the server is UP and running and reachable.
SIP server availability
You want to check the availability of the SIP server by sending SIP requests to SIP ports located at different locations around the world.
Solution:
Configure SIP synthetic monitor to check the user VOIP communications availability or performance issues.
TCP port availability
You want to check the accessibility and availability of the port of the TCP server.
Solution:
Configure the TCP synthetic monitor to check the time taken to connect to the TCP server.
UDP port availability admin-guide
You want to check the reachability and availability of the port of the UDP server.
Solution:
Configure the UDP synthetic monitor to check the time taken to connect to the UDP server.
401 Bad API
You encounter 401 Bad API Credentials error while accessing the website.
Solution:
Create credentials according to the authentication type. This applies only to the HTTPS/HTTP synthetic monitor.