The Cisco Viptela (SD-WAN) integration allows for the visibility of network devices, links, and application traffic, helping you ensure that your WAN is performing optimally. Upon installation, you can discover Cisco Viptella components, view resource relationships, monitor job metrics, and receive alerts for efficient maintenance.
Prerequisites
- OpsRamp Classic Gateway (Linux) version 15.0.0 or later, or OpsRamp Nextgen Gateway version 15.0.0 or later is required.
- For best results, use the latest Gateway version to benefit from recent bug fixes and enhancements.
- You must provide valid Viptela Provider API login credentials.
- The Viptela Manager device must be accessible from the gateway, and the default port (8443) should be open.
- The assigned credentials must have read privileges to collect all required data.
- Required read permissions include:
- Device Inventory
- Device Monitoring
- Events
- Alarms
- Interface
- Routing
- Auditing
Configure Cisco Viptela (SD-WAN) Integration
Click here to configure and install the Cisco Viptela (SD-WAN) Integration
To select your client, navigate to All Clients and select the Client/Partner from the dropdown menu.
Note
You may either type your client’s name in the search bar or select your client from the list.Navigate to Setup > Account. The Account Details screen appears.
Click Integrations. The Installed Integrations screen appears, showing all installed applications..
Note: If you do not have any installed applications, you will be navigated to the Available Integrations and Apps page with all the available applications along with the newly created application with the version.Click + ADD on the Installed Integrations page.
Note
You can search for the integration by name or by category in the All Categories dropdown.Click ADD in the Cisco Viptela (SD-WAN) application.
On the Configuration screen, click + ADD. The Add Configuration screen appears.
Enter the following BASIC INFORMATION:

| Field Name | Field Type | Description |
|---|---|---|
| Name | String | Enter a unique name for this integration configuration. |
| Host Name / IP Address | String | Specify the domain name or IP address of the Cisco Viptela Manager. This is used by OpsRamp to connect to the device. |
| Is Secure | Checkbox | Select to enable secure communication (HTTPS/SSL). Default: Enabled. When checked, all data is encrypted in transit. |
| Port | Integer | Enter the port number for connecting to the Viptela Manager. Default: 443. |
| Credentials | String | Select or add credentials for authentication. To add new credentials, click +ADD and complete the following fields in the ADD CREDENTIAL dialog:
|
| App Failure Notifications | Checkbox | Enable to receive notifications if the integration encounters failures, such as connectivity or authentication errors. |
| Event Polling | Section | Configure how OpsRamp polls for events or incidents from Cisco Viptela. |
| Alert Configuration | Checkbox | Enable to generate alerts based on polled events. When selected, alerts are triggered according to the defined rules. |
| CUSTOM ATTRIBUTES | Section | Specify custom metadata or properties for this integration. You can select from predefined attributes and assign values as needed. |
| Custom Attribute | Dropdown | Select a custom attribute from the list. |
| Value | Dropdown | Enter or select the value for the chosen custom attribute. |
| Resource Type | Toggle |
|
| DISCOVERY SCHEDULE | Toggle | Set how often OpsRamp discovers and updates resources:
|
- Click ADD.

The configuration is saved and displayed on the configurations page after you save it.Note: From the same page, you may Edit and Remove the created configuration.
12. Under the ADVANCED SETTINGS, select the Bypass Resource Reconciliation option, if you wish to bypass resource reconciliation when encountering the same resources discovered by multiple applications.
Note: If two different applications provide identical discovery attributes, two separate resources will be generated with those respective attributes from the individual discoveries.
13. Click NEXT.
14. (Optional) Click +ADD to create a new collector. You can either use the pre-populated name or give the name to your collector.
15. Select an existing registered profile.
16. Click FINISH.
The integration is installed and displayed on the INSTALLED INTEGRATION page. Use the search field to find the installed integration.
Modify Cisco Viptela (SD-WAN) Integration
Click here to Modify the Configuration
See Modify an Installed Integration or Application article.
Note: Select Cisco Viptela (SD-WAN).
Discover Resources in Cisco Viptela (SD-WAN) Integration
Click here to View the Cisco Viptela (SD-WAN) Details
To discover resources for Cisco Viptela (SD-WAN) Storage:
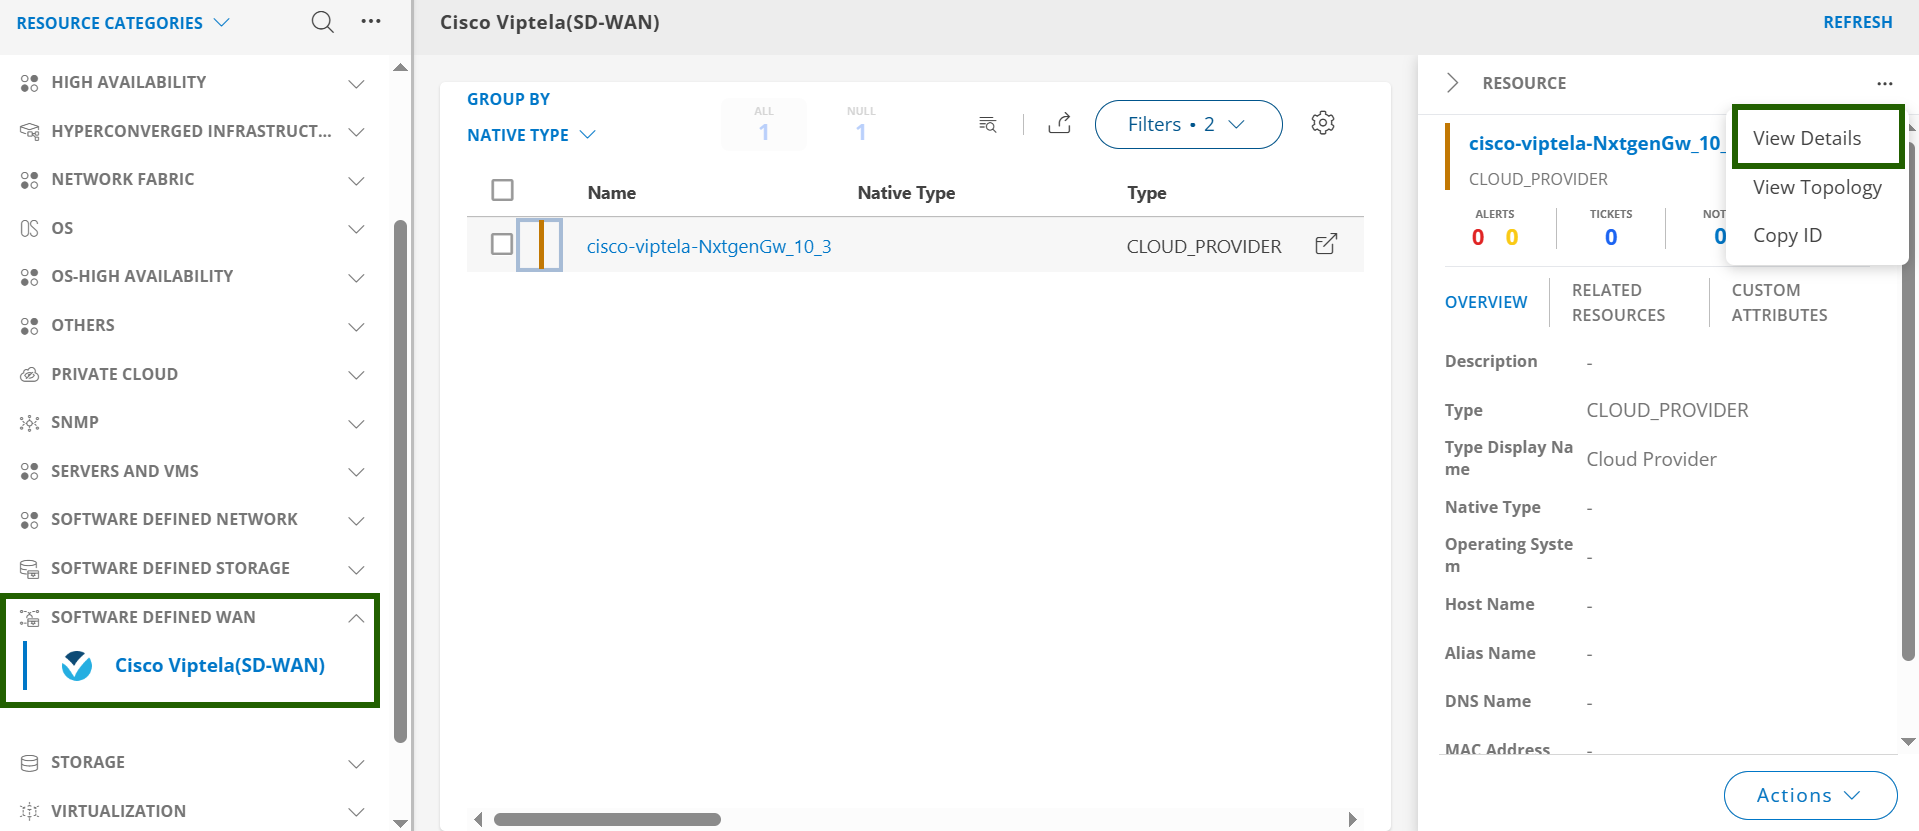
- Navigate to Infrastructure > Search > SOFTWARE DEFINED WAN > Cisco Viptela (SD-WAN). The Cisco Viptela (SD-WAN) page is displayed.
- Select the application on the Cisco Viptela (SD-WAN) page
- The RESOURCE page appears from the right.
- Click the ellipsis (…) on the top right and select View Details.
- Navigate to the Attributes tab to view the discovery details.

View resource metrics
To confirm Cisco Viptela (SD-WAN) monitoring, review the following:
- Metric graphs: A graph is plotted for each metric that is enabled in the configuration.
- Alerts: Alerts are generated for metrics that are configured as defined for integration.
- Click the Metrics tab to view the metric details for Cisco Viptela (SD-WAN).