| Supported Versions |
|---|
| REST APIs: Hitachi HCI REST API 1.6.3 |
| Gateway version: 8.0 HF cg and above |
Introduction
Hitachi Content Intelligence (HCI), is an end-to-end data processing and retrieval solution that automates the extraction, classification and categorisation of data residing in public, private and hybrid clouds.
HCI is integrated with REST APIs that are exposed through HCI cluster instances.
Prerequisite
- OpsRamp classic gateway 10.0.0 and above.
Supported metrics
Click here to view the supported metrics
| HCI Component | OpsRamp Metric Name | OpsRamp Metric Display Name | Metric Units |
|---|---|---|---|
| Instance | hci_Instance_IsMaster | hci instance is master | Boolean |
| hci_Instance_HealthStatus | hci instance health status | Enum (Up,Down) | |
| hci_instance_UsedMemory | hci instance total memory used | GB | |
| hci_Instance_ServiceUnitStatus | hci instance serviceunit status | Enum (Good) | |
| hci_Instance_DiskUtilization | hci instance total disk usage | GB | |
| hci_Instance_AllocatedServiceUnits | hci instance allocated service units | Count | |
| hci_Instance_CPUUtilization | hci instance total cpu percentage | % | |
| hci_Instance_DiskFreeSpace | hci instance disk free space | GB | |
| hci_Instance_LoadAvg1 | hci instance load avg1 | % | |
| hci_Instance_LoadAvg5 | hci instance load avg5 | % | |
| hci_Instance_LoadAvg10 | HCI Disk Free Space Percentage | % | |
| hci_Instance_DiskFreeSpace_percentage | hci instance load avg10 | % | |
| Service | hci_Service_HealthStatus | hci service health status | Enum (Healthy) |
| hci_Service_IsVirtualService | hci service isvirtual service | Boolean | |
| hci_Service_DiskUsage | hci service disk usage | GB | |
| hci_Service_MemoryUsed | hci service memory usage | GB | |
| hci_Service_MemoryLimit | hci service memory limit | GB | |
| hci_Service_CPUUtilization | hci service cpuutilization | % | |
| hci_Service_Memory_Utilization | HCI Service Memory Utilization | % | |
| hci_Service_Disk_Utilization | HCI Service Disk Utilization | % | |
| Job | hci_Job_HealthStatus | hci job health status | Enum (Completed) |
| hci_Job_ServiceUnits | hci job service units | Count | |
| hci_Job_TotalErrorCount | hci job total error count | Count |
Configure the integration
- From All Clients, select a client.
- Go to Setup > Account.
- Select the Integrations and Apps tab.
- The Installed Integrations page, where all the installed applications are displayed. If there are no installed applications, it will navigate to the Available Integrations and Apps page.
- Click + ADD on the Installed Integrations page. The Available Integrations and Apps page displays all the available applications along with the newly created application with the version.
Note: Search for the application using the search option available. Also you can use the All Categories option to search. - Click ADD in Hitachi HCI and click Install.
- Add Configuration, select Add.
- Enter:
- Name - configuration name
- HCI IP address
- Port
- Protocol
- Credentials: Enter username and password
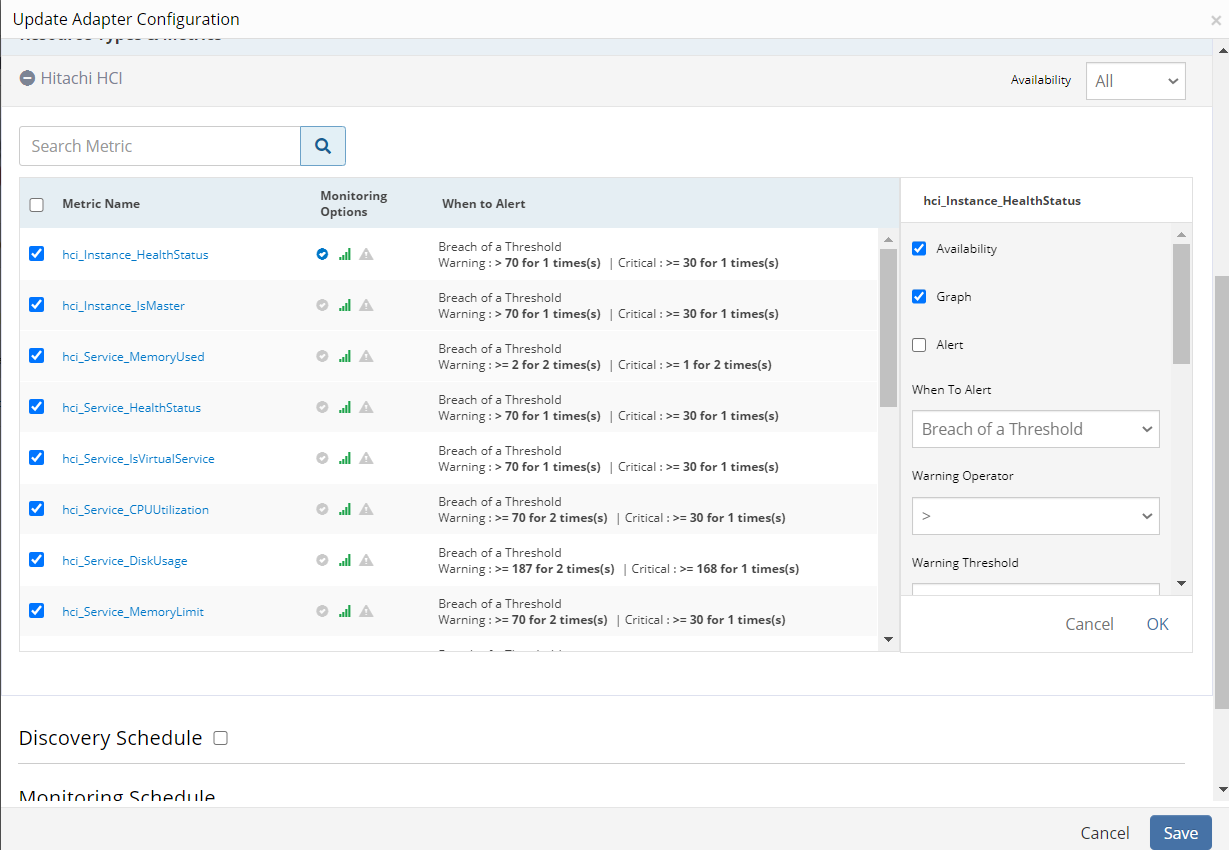
- Select Resource Types & Metrics
- Configure threshold values and alert conditions for one or more metrics
- Click Save.

Add a discovery and monitoring schedule
- From the Update Adapter Configuration section, enable Discovery Schedule.
- Select Recurrence Pattern from the drop-down values and configure.
- Update Monitoring Schedule. By default it is set to 30 minutes.
- Save the integration.
After the integration is saved properly, the Hitachi HCI server is discovered and monitoring is enabled as per the configured metric criteria. The configured resource is displayed in the Hitachi HCI category in the Infrastructure page.
Next steps
After integration profile is created, you can do the following:
- View the integration: Go to Infrastructure > Resources.
- Validate that the resource was successfully added to OpsRamp.
- View metrics graphs from the Infrastructure > Metrics.
To confirm the monitoring of Hitachi HCI resource, review the following:
- The graph plotted for each metric that is enabled in the configuration.
- Alerts generated for metrics that are configured as per defined integration.
Risks, Limitations & Assumptions
- The availability is shown unknown for few resources even if it is enabled on the respective resource metrics. This is because of the presence of multiple native type resources under the same resource type.
- Availability metric selection is mandatory while adding the adapter configuration.