Introduction
Redfish is a standard that uses RESTful interface semantics to access a schema based data model to conduct management operations. The Redfish Scalable Platforms Management API is a standard defined by the Distributed Management Task Force (DMTF). Redfish is a next-generation systems management interface standard, which enables scalable, secure, and open server management. It is a new interface that uses RESTful interface semantics to access data that is defined in model format to perform out-of-band systems management. It is suitable for a wide range of servers ranging from stand-alone servers to rack mount and bladed environments and for large scale cloud environments
Being model-oriented, it can express the relationships between components and the semantics of the Redfish services and components within them. The model is also easy to extend and by requiring JSON representation, Redfish enables easy integration with programming environments. It is also easy to interpret by humans. An interoperable Redfish schema defines this model, which is freely available and published in OpenAPI YAML, OData CSDL, and JSON Schema formats.
Key Use Cases
Discovery Use Cases:
- Provides resource visibility to the administrator to view and manage resources available (Ex: Manager, Chassis, Systems, Network Adapters, PCIe Devices and PCIe Functions, Power, Thermals) under different resource types.
- Publishes relationships between resources to have a topological view and ease of maintenance.
Monitoring Use Cases:
- Provides metrics related to CPU Utilization, Memory Utilization, Performance Utilization and Health Monitoring and so on for different resources.
- Concern alerts will be generated for each metric to notify the administrator regarding the issue with the resource.
Prerequisites
- Classic Gateway (Linux) version should be 14.0.0 and above.
- Nextgen gateway version should be 14.0.0 and above.
Note
OpsRamp recommends using the latest Gateway version for full coverage of recent bug fixes, enhancements, and so on. - Ensure that the target server supports Redfish API and is reachable from the OpsRamp Gateway.
- The integration requires network connectivity on port 443 (HTTPS) or the custom Redfish port configured on the device.
- You must create a local user account on the target device to authenticate Redfish API calls.
- The local user should be assigned the Read only role or at minimum have the Login privilege.
- These permissions are sufficient to fetch hardware metrics and event logs using the Redfish API.
- Administrator-level access is not required.
- For HPE devices, refer to the official HPE documentation on Redfish user roles and privileges
Note
Future releases will remove discovery and monitoring for Firmware and Software native types.
Configure and Install the Redfish - Server Integration
- From All Clients, select a client.
- Go to Setup > Account.
- Select the Integrations and Apps tab.
- The Installed Integrations page, where all the installed applications are displayed.
Note: If there are no installed applications, it will navigate to the Available Integrations and Apps page. - Click + ADD on the Installed Integrations page. The Available Integrations and Apps page displays all the available applications along with the newly created application with the version.
Note: Search for the application using the search option available. Also you can use the All Categories option to search. - Click ADD in the Redfish - Server application.
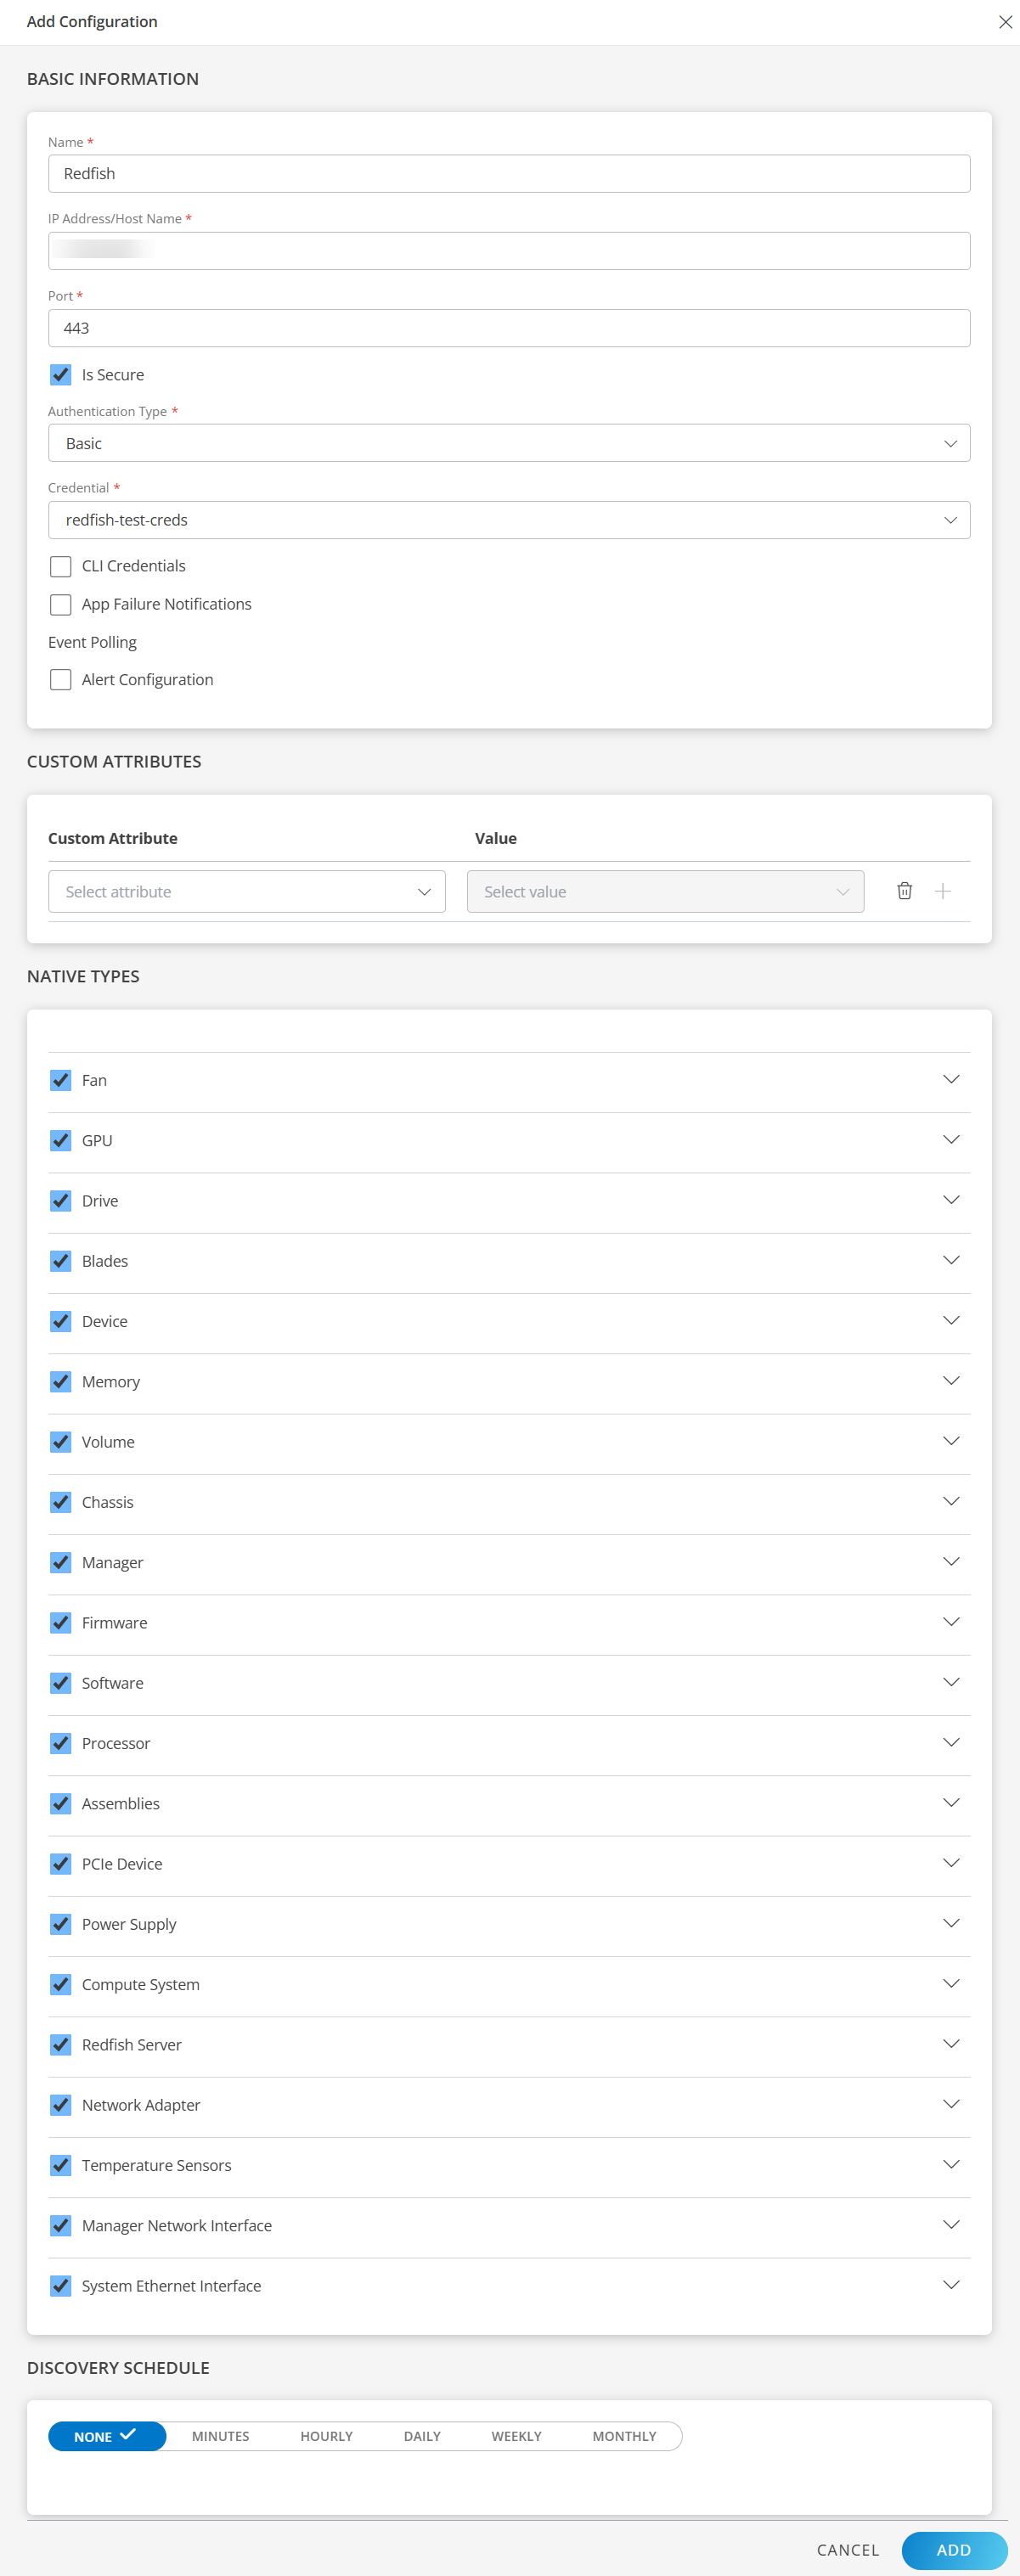
- In the Configurations page, click + ADD. The Add Configuration page appears.
- Enter the following BASIC INFORMATION:
| Field Name | Description | Field Type |
|---|---|---|
| Name | Enter the name for the configuration. | String |
| IP Address/Host Name | Specify the IP address or hostname of the Redfish-enabled system (BMC endpoint). | String |
| Port | Enter the port number for Redfish API communication. Note: By default 443 is added. | |
| Is Secure | Select this checkbox if you want the communication between your system and the specified endpoint to be secured using protocols such as HTTPS (HTTP over SSL/TLS). Default Selection: When selected, it signifies that the connection is encrypted, providing an added layer of security to the data being transmitted. | Checkbox |
| AuthenticationType | Select the authentication mechanism for connecting to the Redfish API.Note: Choose one of the following options from the authenticationType dropdown based on your environment or security requirements:
| Dropdown |
| Credential | Select the stored credential to authenticate with the Redfish service. If you want to use the existing credentials, select them from the Select Credentials dropdown. Else, click +ADD to create credentials. The ADD CREDENTIAL window is displayed. Enter the following information.
Note Read-only Redfish API access. You must have privileges to access /redfish/v1/Systems, /Managers, and /Chassis endpoints. | Dropdown |
| CLI Credentials | Enable this option if CLI-based access (like SSH) is needed for extended data collection. | Checkbox |
| CLI Credential | Displayed when the CLI Credentials field is selected. Enable this option if CLI-based access (like SSH) is needed for extended data collection. Select the stored credential to authenticate with the Redfish service. If you want to use the existing credentials, select them from the Select Credentials dropdown. Else, click +ADD to create credentials. The ADD CREDENTIAL window is displayed. Enter the following information.
| Checkbox |
| App Failure Notifications | When selected, you will be notified in case of an application failure such as Connectivity Exception, Authentication Exception. | Checkbox |
| Alert Configuration | Enable this field to collect IML event logs from HPE ProLiant servers and IPMI/BIOS event logs from HPE Cray systems, if required. | Checkbox |
| Alert On Root Resource | Appears when Alert Configuration checkbox is selected. Select this checkbox to generate event polling alerts on root resource. | Checkbox |
| Alert Severity Filters | Possible values of Alert Severity filter configuration property are ["Critical", "OK", "Warning"] | String |
| Alert Severity Map | Provides alert severity map configuration. Default values for Alert Severity Mapping configuration are ["Critical", "OK", "Warning"] | String |
- CUSTOM ATTRIBUTES: Custom attributes are the user-defined data fields or properties that can be added to the preexisting attributes to configure the integration.
| Field Name | Description | Field Type |
|---|---|---|
| Custom Attribute | Select the custom attribute from the dropdown. You can add attributes by clicking the Add icon (+). | Dropdown |
| Value | Select the value from the dropdown. | Dropdown |
Note: The custom attribute that you add here will be assigned to all the resources that are created by the integration. You can add a maximum of five custom attributes (key and value pair).
- In the RESOURCE TYPE section, select:
- ALL: All the existing and future resources will be discovered.
- SELECT: You can select one or multiple resources to be discovered.
- In the DISCOVERY SCHEDULE section, select recurrence pattern to add one of the following patterns:
- Minutes
- Hourly
- Daily
- Weekly
- Monthly
- Click ADD.
Now the configuration is saved and displayed on the configurations page after you save it.
Note: From the same page, you may Edit and Remove the created configuration.
Under the ADVANCED SETTINGS, Select the Bypass Resource Reconciliation option, if you wish to bypass resource reconciliation when encountering the same resources discovered by multiple applications.
Note: If two different applications provide identical discovery attributes, two separate resources will be generated with those respective attributes from the individual discoveries.
Click NEXT.
(Optional) Click +ADD to create a new collector by providing a name or use the pre-populated name.
Select an existing registered profile.
Click FINISH.
The application is installed and displayed on the INSTALLED INTEGRATION page. Use the search field to find the installed integration.
Modify the Configuration
See Modify an Installed Integration or Application article.
Note: Select the Redfish - Server application.
View the Redfish - Server Details
To discover resources for Redfish - Server:
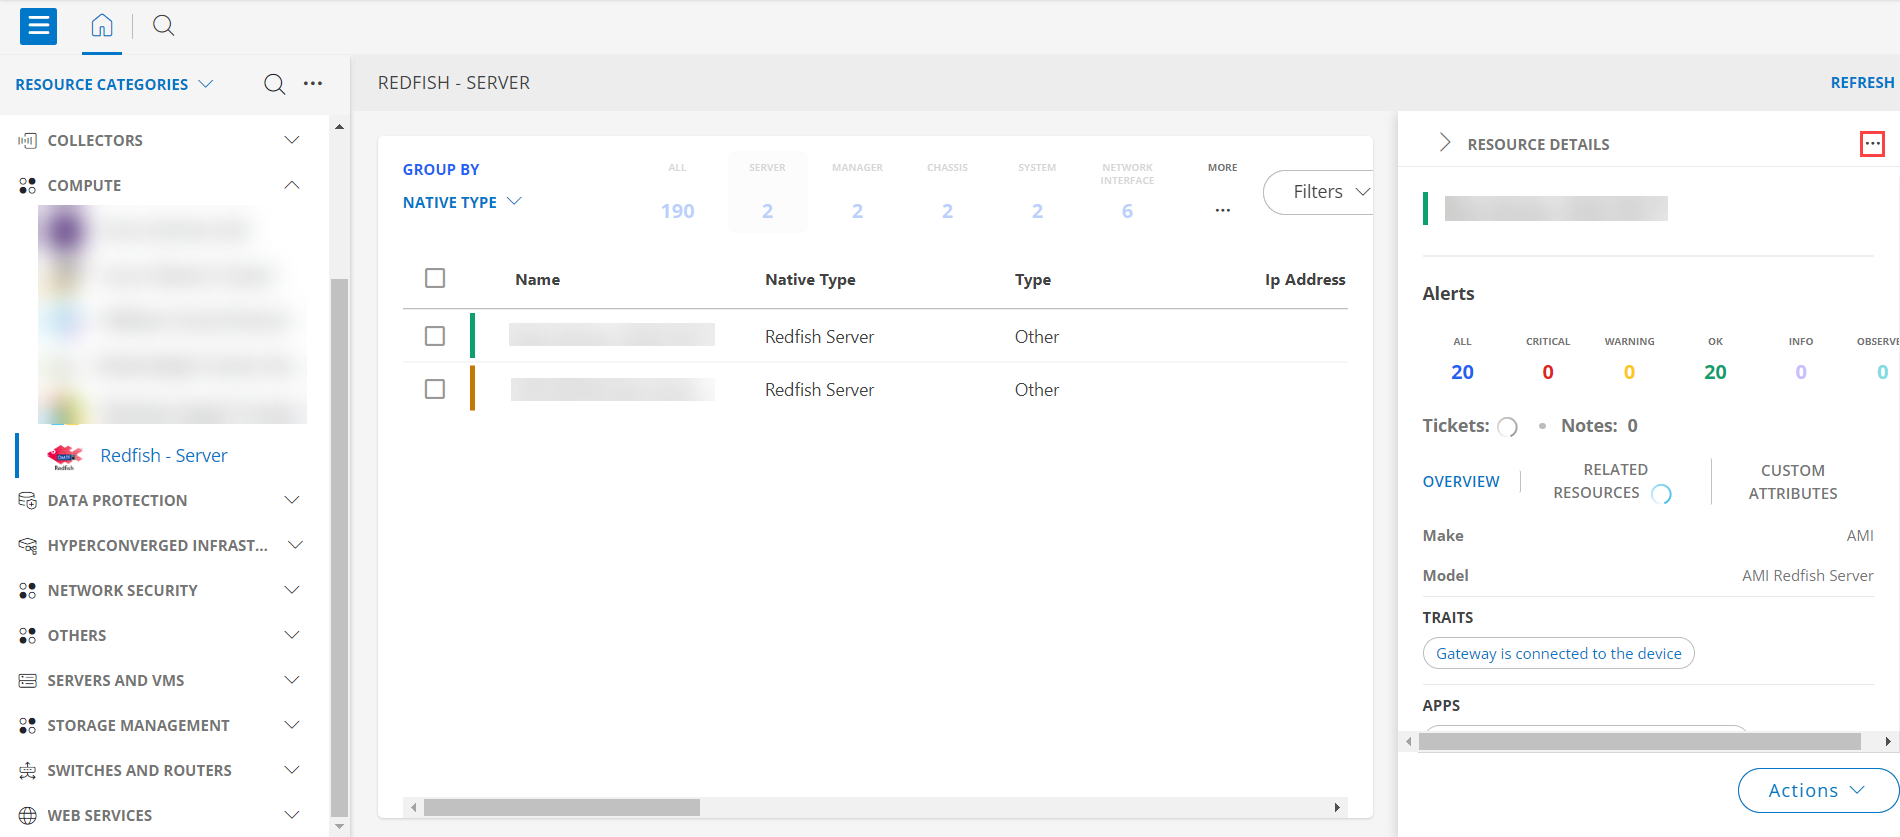
- Navigate to Infrastructure > Search > COMPUTE > Redfish - Server.
- The REDFISH - SERVER page is displayed, select the application name.
- The RESOURCE DETAILS page appears from the right.
- Click the ellipsis (…) on the top right and select View details.
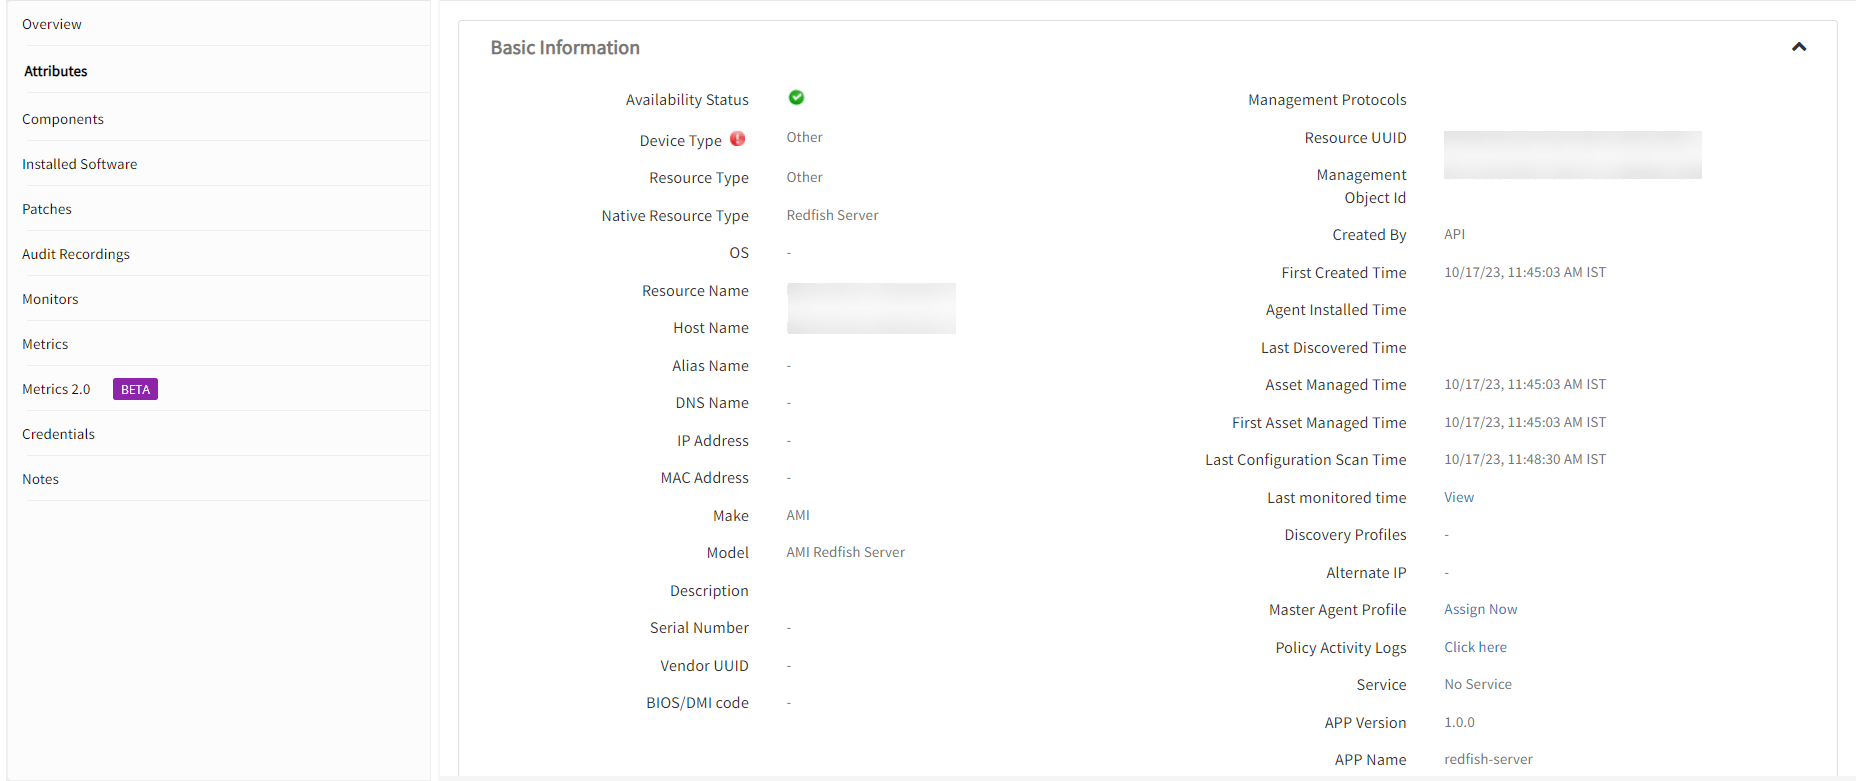
- Navigate to the Attributes tab to view the discovery details.
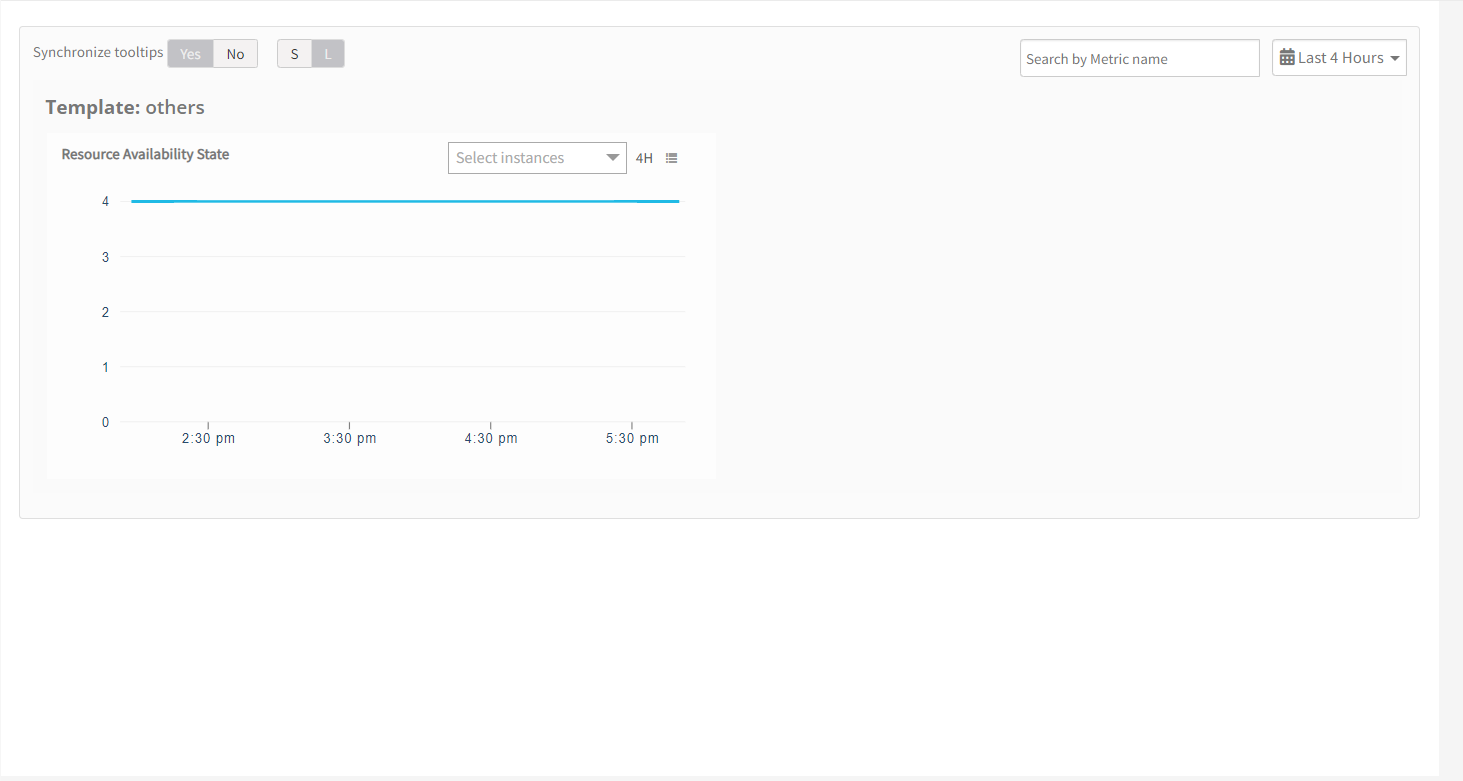
- Click the Metrics tab to view the metric details for Redfish - Server.
View resource metrics
To confirm Redfish - Server monitoring, review the following:
- Metric graphs: A graph is plotted for each metric that is enabled in the configuration.
- Alerts: Alerts are generated for metrics that are configured as defined for integration.
Default Monitoring Configuration
Redfish has default Global Device Management Policies, Global Templates, Global Monitors and Global Metrics in OpsRamp. You can customize these default monitoring configurations as per your business requirement by cloning respective Global Templates and Global Device Management Policies. It is recommended to clone them before installing the application to avoid noise alerts and data.
Default Global Device Management Policies
You can find the Device Management Policy for each Native Type at Setup > Resources > Device Management Policies. Search with suggested names in global scope:
{appName nativeType - version}Ex: redfish-server Chassis - 1 (i.e, appName = redfish-server, nativeType =Chassis, version = 1)
Default Global Templates
You can find the Global Templates for each Native Type at Setup > Monitoring > Templates. Search with suggested names in global scope. Each template adheres to the following naming convention:
{appName nativeType 'Template' - version}Ex: redfish-server Chassis Template - 1 (i.e, appName = redfish-server, nativeType =Chassis, version = 1)
Default Global Monitors
You can find the Global Monitors for each Native Type at Setup > Monitoring > Monitors. Search with suggested names in global scope. Each Monitors adheres to the following naming convention:
{monitorKey appName nativeType - version}Ex: redfish-server Chassis Health Monitor redfish-server Chassis 1(i.e, monitorKey = Chassis Health, appName = redfish-server, nativeType = Chassis, version = 1)
Resource Filter Input keys
Redfish application Resources are filtered and discovered based on below keys:
Click here to view the Supported Input Keys
| Resource Type | Supported Input Keys |
|---|---|
| All Types | resourceName |
| hostName | |
| aliasName | |
| dnsName | |
| ipAddress | |
| macAddress | |
| os | |
| make | |
| model | |
| serialNumber | |
| Redfish Server | CloudConnectStatus |
| Manager | CloudConnectStatus |
| ManagerId | |
| ManagerType | |
| FirmwareVersion | |
| ResourceState | |
| Root Resource UUID | |
| Root Resource HostName | |
| Root Resource IPAddress | |
| Root Resource Name | |
| Root Resource SerialNumber | |
| Manager Network Interface | InterfaceId |
| PermanentMACAddress | |
| FQDN | |
| IPv6Addresses | |
| Description | |
| AutoNeg | |
| FullDuplex | |
| MACAddress | |
| IPv4Addresses | |
| ResourceState | |
| Root Resource UUID | |
| Root Resource HostName | |
| Root Resource IPAddress | |
| Root Resource Name | |
| Root Resource SerialNumber | |
| Chassis | ChassisId |
| ChassisType | |
| PartNumber | |
| AssetTag | |
| SKU | |
| EnvironmentalClass | |
| FirmwareVersion | |
| SystemProgrammableLogicDeviceVersion | |
| Description | |
| ResourceState | |
| Root Resource UUID | |
| Root Resource HostName | |
| Root Resource IPAddress | |
| Root Resource Name | |
| Root Resource SerialNumber | |
| Compute System | Redundant System ROM |
| Intelligent Provisioning | |
| ComputeSystemId | |
| BiosVersion | |
| AssetTag | |
| SystemType | |
| PartNumber | |
| SKU | |
| SubModel | |
| OsType | |
| OsVersion | |
| PCAPartNumber | |
| PCASerialNumber | |
| ServerFQDN | |
| ProcessorModel | |
| TotalSystemMemoryGiB | |
| TotalSystemPersistentMemoryGiB | |
| Description | |
| ResourceState | |
| Root Resource UUID | |
| Root Resource HostName | |
| Root Resource IPAddress | |
| Root Resource Name | |
| Root Resource SerialNumber | |
| System Ethernet Interface | EthernetInterfaceId |
| IPv6Addresses | |
| EthernetInterfaceType | |
| UefiDevicePath | |
| FullDuplex | |
| SpeedMbps | |
| InterfaceEnabled | |
| MACAddress | |
| IPv4Addresses | |
| ResourceState | |
| Root Resource UUID | |
| Root Resource HostName | |
| Root Resource IPAddress | |
| Root Resource Name | |
| Root Resource SerialNumber | |
| Processor | ProcessorId |
| ProcessorType | |
| Socket | |
| PartNumber | |
| ProcessorArchitecture | |
| TotalCores | |
| TotalThreads | |
| MaxSpeedMHz | |
| RatedSpeedMHz | |
| AssetTag | |
| ExternalClockMHz | |
| ResourceState | |
| Root Resource UUID | |
| Root Resource HostName | |
| Root Resource IPAddress | |
| Root Resource Name | |
| Root Resource SerialNumber | |
| Drive | DriveId |
| MediaType | |
| AssetTag | |
| ServiceLabel | |
| LocationType | |
| BlockSizeBytes | |
| DriveCapacity GB | |
| FirmwareVersion | |
| Protocol | |
| WriteCacheEnabled | |
| ResourceState | |
| Root Resource UUID | |
| Root Resource HostName | |
| Root Resource IPAddress | |
| Root Resource Name | |
| Root Resource SerialNumber | |
| Volume | WriteCacheState |
| VolumeId | |
| DisplayName | |
| LogicalUnitNumber | |
| RAIDType | |
| VolumeCapacity GB | |
| BlockSizeBytes | |
| Encrypted | |
| Compressed | |
| Deduplicated | |
| WriteCachePolicy | |
| ReadCachePolicy | |
| ResourceState | |
| Root Resource UUID | |
| Root Resource HostName | |
| Root Resource IPAddress | |
| Root Resource Name | |
| Root Resource SerialNumber | |
| Memory | MemoryControllerId |
| PartNumber | |
| MemoryType | |
| MemoryDeviceType | |
| VendorId | |
| DeviceLocator | |
| MemoryCapacity GB / CapacityMiB | |
| OperatingSpeedMhz | |
| MemorySubsystemControllerManufacturerID | |
| MemorySubsystemControllerProductID | |
| ModuleManufacturerID | |
| ModuleProductID | |
| BaseModuleType | |
| VolatileSizeMiB | |
| VolatileRegionSizeLimitMiB | |
| LogicalSizeMiB | |
| ResourceState | |
| Root Resource UUID | |
| Root Resource HostName | |
| Root Resource IPAddress | |
| Root Resource Name | |
| Root Resource SerialNumber | |
| Device | DeviceId |
| FirmwareVersion | |
| PartNumber | |
| Location | |
| ProductPartNumber | |
| ProductVersion | |
| ResourceState | |
| Root Resource UUID | |
| Root Resource HostName | |
| Root Resource IPAddress | |
| Root Resource Name | |
| Root Resource SerialNumber | |
| Network Adapter | FirmwareVersion |
| NetworkAdapterId | |
| PartNumber | |
| LocationType | |
| ServiceLabel | |
| ResourceState | |
| Root Resource UUID | |
| Root Resource HostName | |
| Root Resource IPAddress | |
| Root Resource Name | |
| Root Resource SerialNumber | |
| Power Supply | Actual PowerControl Name |
| FirmwareVersion | |
| PowerSupplyType | |
| SparePartNumber | |
| PowerCapacityWatts | |
| BayNumber | |
| MaxPowerOutputWatts | |
| ResourceState | |
| Root Resource UUID | |
| Root Resource HostName | |
| Root Resource IPAddress | |
| Root Resource Name | |
| Root Resource SerialNumber | |
| Fan | MemberId |
| Location | |
| HotPluggable | |
| Redundant | |
| ResourceState | |
| Root Resource UUID | |
| Root Resource HostName | |
| Root Resource IPAddress | |
| Root Resource Name | |
| Root Resource SerialNumber | |
| Temperature Sensors | MemberId |
| PhysicalContext | |
| SensorNumber | |
| UpperThresholdFatal | |
| UpperThresholdCritical | |
| ResourceState | |
| Root Resource UUID | |
| Root Resource HostName | |
| Root Resource IPAddress | |
| Root Resource Name | |
| Root Resource SerialNumber | |
| PCIe Device | Part Number |
| FirmwareVersion | |
| ResourceState | |
| Root Resource UUID | |
| Root Resource HostName | |
| Root Resource IPAddress | |
| Root Resource Name | |
| Root Resource SerialNumber | |
| Assemblies | Part Number |
| Producer | |
| Spare Part Number | |
| ResourceState | |
| Root Resource UUID | |
| Root Resource HostName | |
| Root Resource IPAddress | |
| Root Resource Name | |
| Root Resource SerialNumber |
Supported Alert Custom Macros
Customize the alert subject and description with below macros then it will generate alerts based on customisation.
Click here to view the alert subject and description with macros
${resource.name}
${resource.ip}
${resource.mac}
${resource.aliasname}
${resource.os}
${resource.type}
${resource.dnsname}
${resource.alternateip}
${resource.make}
${resource.model}
${resource.serialnumber}
${resource.systemId}
${parent.resource.name}
${Custom attributes on the resource}
Risks, Limitations & Assumptions
- You can manage critical/recovery failure alerts for the following two scenarios by enabling App Failure Notifications in the settings:
- Connectivity Exception
- Authentication Exception
- Metrics are used to monitor resources and generate alerts when threshold values are breached.
- Redfish server does not support automatic monitoring pause/resume based on failure alerts.
- The Template Applied Time is displayed only if the collector profile (Classic or NextGen Gateway) is version 18.1.0 or higher.
- Redfish Event/Alert polling starts only if you enable Event/Alert Polling in the configuration.
- For some PowerSupply resources, the API may return the name as empty or null. In such cases, the name is provided as a combination of the string
"PowerSupply"and its ID. Example:PowerSupply_0. - If you are using an Edgeline EL8000 system, ensure the CLI Credentials checkbox is enabled and appropriate CLI credentials are provided.
- Power Control Metrics are available at the Chassis level.
- GPU discovery and monitoring are validated only on the HPE ProLiant DL380 Gen10 and NVIDIA DGX H100 models.
- The resource status is represented both as a custom attribute during discovery and as a metric during monitoring. The discovery attribute is updated less frequently, while the metric reflects near real-time status. Because of this difference in update frequency, discrepancies between the two values are expected.
- Event/Alert polling supports:
- IML event logs for HPE ProLiant servers.
- IPMI and BIOS logs for HPE Cray systems.
- IPMI and BIOS log collection has been validated only on the Cray XD670 model.
- By default, Redfish event severities are mapped to OpsRamp severity levels as part of the Alert Severity Mapping configuration.
- You can modify these severity mappings anytime from the integration’s configuration page. Supported OpsRamp severities include: Critical, Warning, Ok, and Info.
- No default template is available for the Redfish Server Native Type, as no functional metrics are available for this resource.
Version History
| Application Version | Bug fixes / Enhancements |
|---|---|
| 10.0.2 | Included Root Resource SerialNumber as custom attribute for all the child native types. |
| 10.0.1 | Fixed Fan and Temperature Sensor Monitoring when “Redfish Model” is empty. |
| 10.0.0 |
|
| 9.2.0 | Added “adapterConfigId” as customAlertTag for Redfish Alerts. |
| 9.1.2 |
|
| 9.1.1 | Fixed the issue for Processor NativeType monitoring for SuperDome Flex-280 model. |
| 9.1.0 | Enabled session-based API authentication and continued support for basic authentication. |
| 9.0.1 | Modified the resource attribute for System Ethernet Interfaces and Manager Network Interface Native Types. |
| 9.0.0 |
|
| 8.0.1 | Fixed Native Type “Fan” discovery in ProLiant Models. |
| 8.0.0 |
|
| 7.0.0 |
|
| 6.0.1 | Support added for Dell PowerEdge MX7000 (Chassis Model) and Fujitsu PRIMERGY RX2540 M5. |
| 6.0.0 | Support added for HPE Cray XD 670 Model and IPMI Logs support. |
| 5.0.0 | Supported new nativetypes Firmware and Software. |
| 4.0.1 | Support Added for Dell IDRAC AX-650 model. |
| 4.0.0 |
|
Click here to view the earlier version updates
| Application Version | Bug fixes / Enhancements |
|---|---|
| 3.0.0 | Added support for IML Event Logs for Proliant Models and added support for Power Metrics on chassis. |
| 2.0.1 | For Redfish Server App we are observing frequent Resource Not Found Exceptions. For this provided fix with retry logic. |
| 2.0.0 | Added support for new model HPE Edgeline EL8000 in Redfish Application. |
| 1.0.1 | Modified moid's to avoid resource reconciliation for different models. |
| 1.0.0 | Initial version with discovery, monitoring, alerts. |